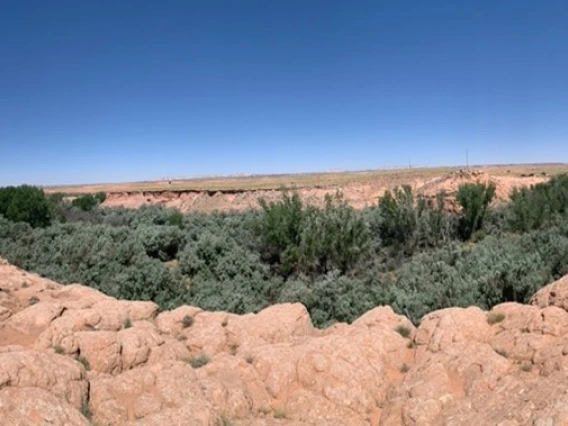
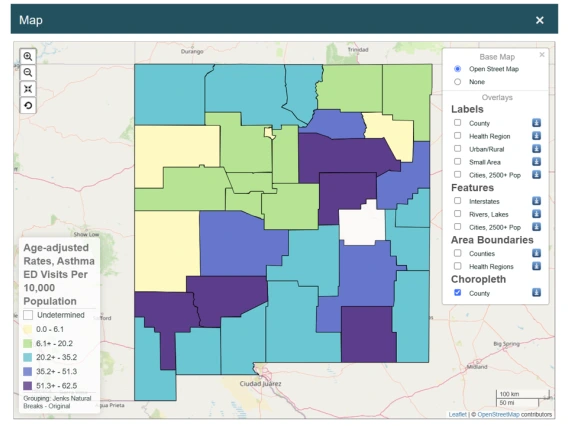
Image Re-Thinking Land and History: Working with Navajo Mountain Soil Water Conservation District Members Oct. 26, 2023 Read more
A Social Ecology of Whale-Watching Ecotourism in El Vizcaíno April 22, 2022 The Baja California Peninsula is one of the most naturally stunning parts of our globe, split from the mainland of Mexico by the San Andreas Fault. Yet for decades, outsiders saw the area as an isolated and unproductive land with minimal economic value. Especially following the decline of the local whaling industry in the early 1900s, regional economic opportunities were limited to fishing, irrigated agriculture and ranching outside of the rise of the saltworks industry in 1954 (more on that later). However, the ‘secret’ of Baja California’s natural beauty was destined to get out. In the latter half of the twentieth century, the arid landscape was reimagined by locals and officials as a tourist’s paradise complete with beaches, surfing and—at least for a few months a year—the opportunity to get up close to Pacific gray whales. Read more
Our cities are what we eat - 2022 CLIMAS E&S Fellows Introductions April 22, 2022 It’s late afternoon and I am sitting on the veranda at my parent’s house in the small mountain town of Montagu in the Western Cape Province of South Africa. In front of me lies a fishpond, inhabited mostly by Koi, and beyond that stretches a green lawn scattered with a variety of fruit trees. Some overripe apples have fallen to the ground, enticing several of the plump hens who have free range in the garden. To my left is a large vegetable patch and the chicken coop where my mother collects fresh eggs every morning. Grapevines creep up and over the latticework above my head, creating a dappled shade, and hummingbirds flit around the birdfeeders that have been hung from the pillars. Read more
Reflections on 2021 as a CLIMAS Environment & Society Fellow March 16, 2022 In late August of 2021, I called Rebecca Jim holding back tears. I had met Jim around 2013 when I was working with a coalition to raise awareness about tar sands extraction and to oppose the construction of the southern leg of the Keystone XL pipeline. Jim is the director of Local Environmental Action Demanded (LEAD), and she has devoted much of her life to bringing attention to the Tar Creek Superfund Site and other environmental justice issues in Ottawa County, Oklahoma. Jim’s work was inspiring and exciting to me, and from 2013 to the present, we maintained a relationship centered around our shared concern for environmental justice issues in Oklahoma. As I began my PhD program and envisioning my dissertation research project, I contacted Jim and asked her if there was some way my research could be useful to her and LEAD. She was excited about the possibility, and over time, we developed a collaborative research project focused on residents’ stories and experiences of water and work throughout processes of industrial development, environmental remediation, and ongoing environmental concerns around the Tar Creek Superfund Site. (read more) Read more