Southwest Climate Outlook - El Niño Tracker - October 2020
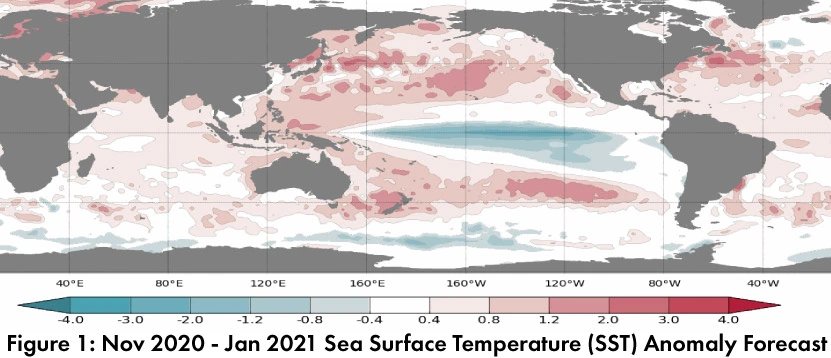
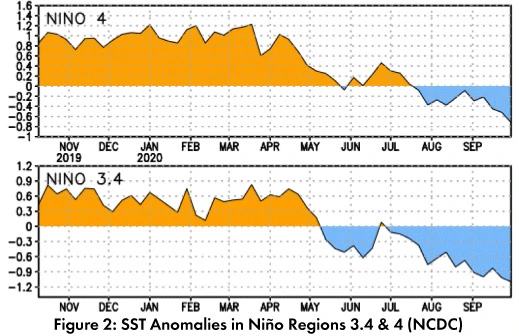
Sea surface temperature (SST) forecasts are for below normal across the equatorial Pacific (Fig. 1), extending the trend of the last 3-4 months (Fig. 2). International climate outlooks describe La Niña conditions as likely to remain a La Niña event through winter 2020.
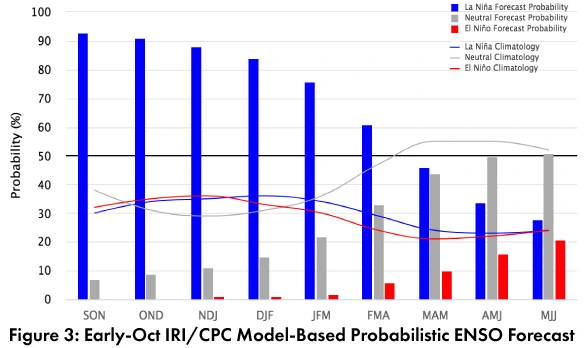
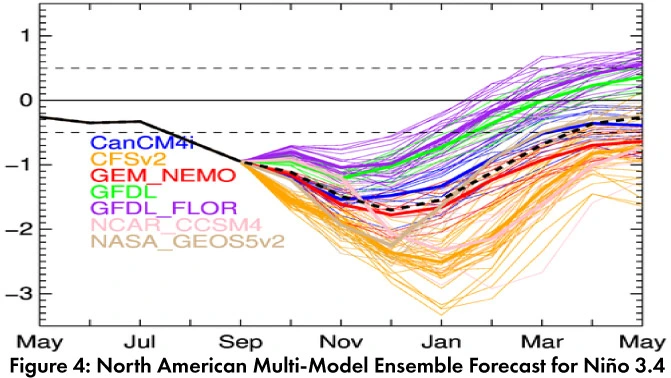
Forecast Roundup: On Oct 8, the NOAA Climate Prediction Center (CPC) ENSO status was at La Niña Advisory. The CPC called for an 85-percent chance of La Niña continuing through winter 2020-2021 and a 60-percent chance of lasting through April 2021. On Oct 8, the International Research Institute (IRI) issued an ENSO Quick Look (Fig. 3), noting “SSTs in the eastcentral Pacific are roughly 1 degree C below average, and all key atmospheric variables are consistent with La Niña conditions”. On Oct 9, the Japanese Meteorological Agency (JMA) elevated its forecast to a 90-percent chance of La Niña conditions to last through winter 2020-2021. On Oct 13, the Australian Bureau of Meteorology was at official La Niña status and noted “around half of the models anticipate a strong event.” They also indicated a shorter duration in comparison to previous strong events (e.g., 2010-2012). The North American Multi-Model Ensemble (dashed black line, Fig. 4) has moved well into La Niña territory, and projections indicate it will remain La Niña until at least early 2021.
Summary: La Niña conditions are present, and most forecasts and outlooks call for these conditions to last through winter 2020-2021. La Niña events tend to result in drier than normal conditions over winter, a pattern found in the monthly and seasonal climate outlooks. The forecast strength of this event (moderate to strong) increases confidence in forecasts that call for a drier than normal winter. If this forecast is correct, it will further exacerbate the precipitation deficits from the monsoon and bring about the uncommon circumstance where consecutive periods of seasonal rainfall in the Southwest (in this case, monsoon 2020, then winter 2020-2021) are both drier than average.
Online Resources
- Figures 1 - Australian Bureau of Meteorology - bom.gov.au/climate/enso
- Figure 2 - NOAA - Climate Prediction Center - cpc.ncep.noaa.gov
- Figure 3 - International Research Institute for Climate and Society - iri.columbia.edu
- Figure 4 - NOAA - Climate Prediction Center - cpc.ncep.noaa.gov