Southwest Climate Outlook July 2019 - Climate Summary
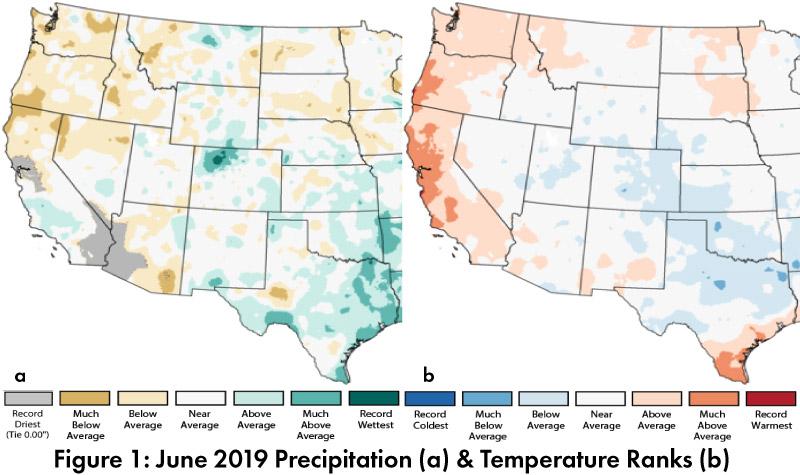
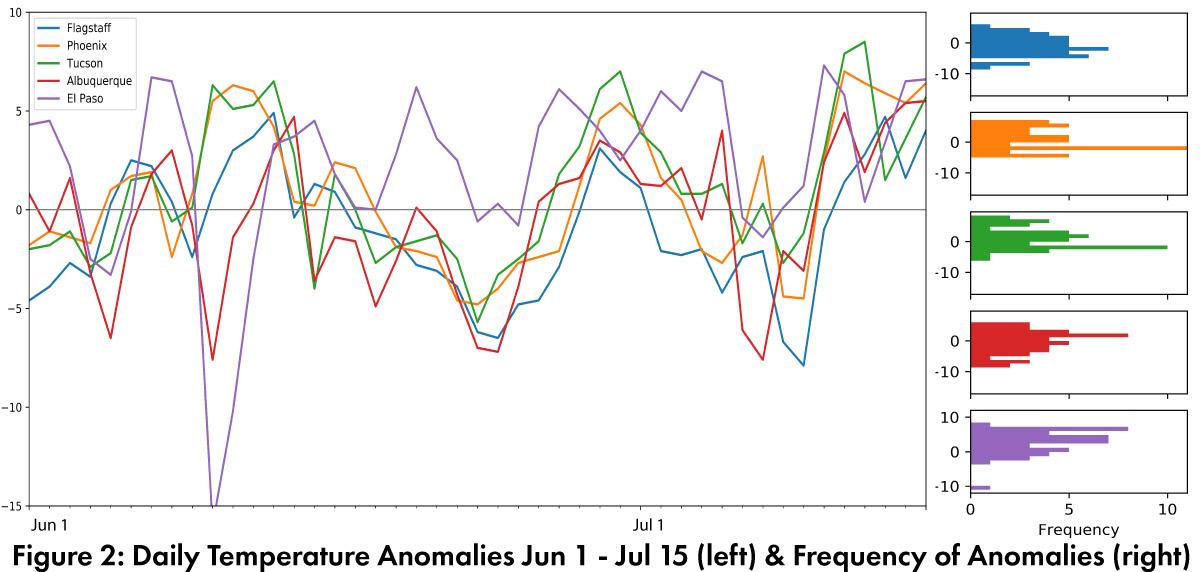
June Precipitation and Temperature Recap: June precipitation was variable in Arizona, ranging from record driest to above average, with a majority of the region recording average to below average precipitation, while New Mexico was mostly average with pockets of both below and above average precipitation (Fig. 1a). June temperatures were mostly average in Arizona and New Mexico, with pockets of above and below average temperatures (Fig. 1b). Daily average temperature anomalies for Jun 1 – Jul 15 demonstrate the fluctuations above and below average (Fig. 2).
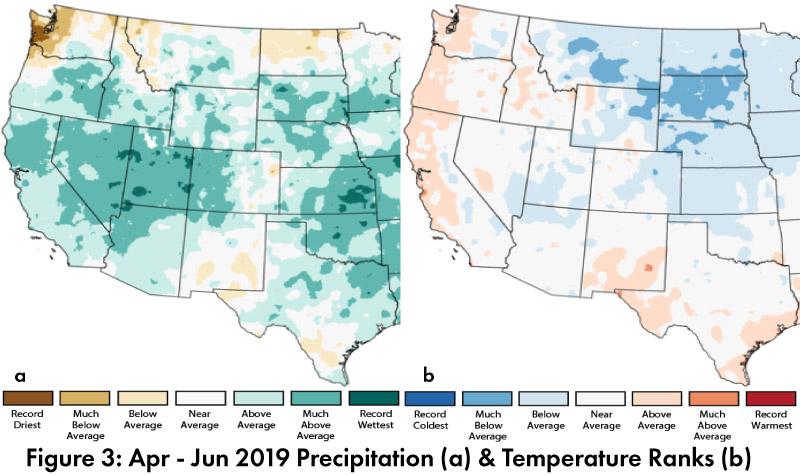
Seasonal Precipitation and Temperature Recap: Cumulative precipitation for April-June was mostly above average to much above average in Arizona, and below average to above average in most of New Mexico (Fig. 3a). Temperatures for the same period were average to below average in Arizona, and average to above average in New Mexico (Fig. 3b).
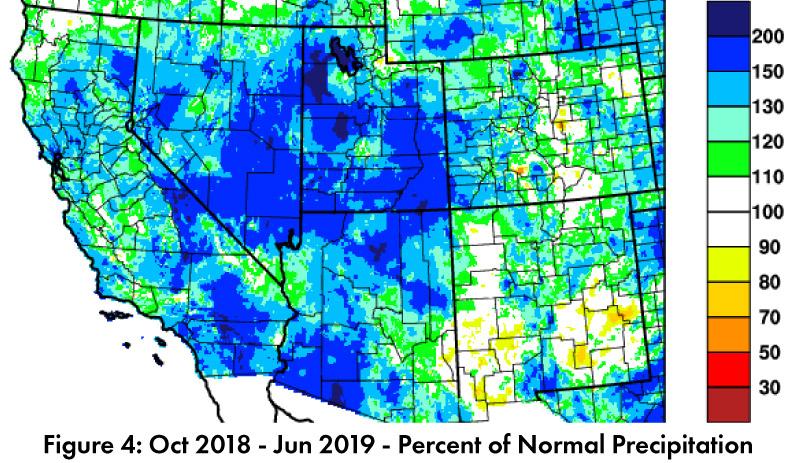
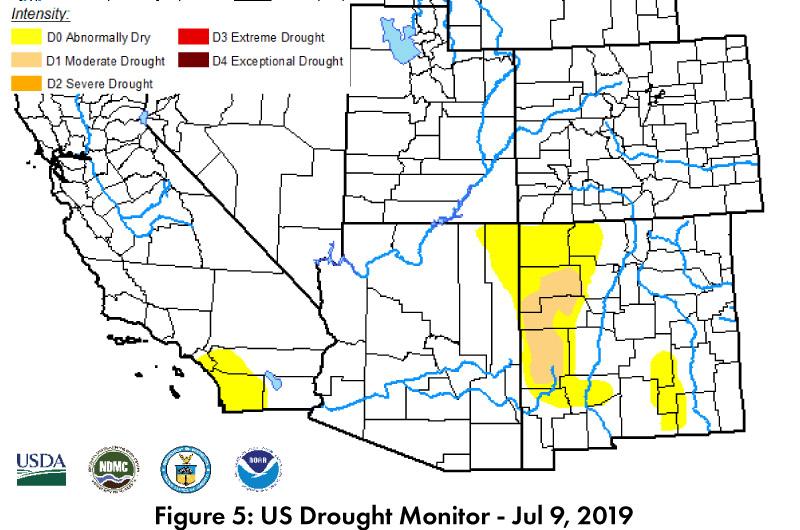
Drought: Water year precipitation to date was above average across much of the Southwest, with Arizona, Utah, Nevada, and southern California doing particularly well, while other areas (i.e. parts of Colorado and New Mexico) were closer to average and even below average (Fig. 4). This extended period of above average precipitation is reflected in the Jul 9 U.S. Drought Monitor (USDM), which continues to document widespread improvements in regional drought conditions in the western United States, and with most of the region no longer classified as experiencing drought (Fig. 5).

Water Supply: Most of the reservoirs in the region are at or above the levels recorded at this time last year, but most reservoirs are also below their long-term average (see Arizona and New Mexico reservoir storage). This highlights the short term improvement in drought conditions and reservoir storage, as well as the accumulated deficits linked to the persistent drought affecting the region for much of the last 20 years.
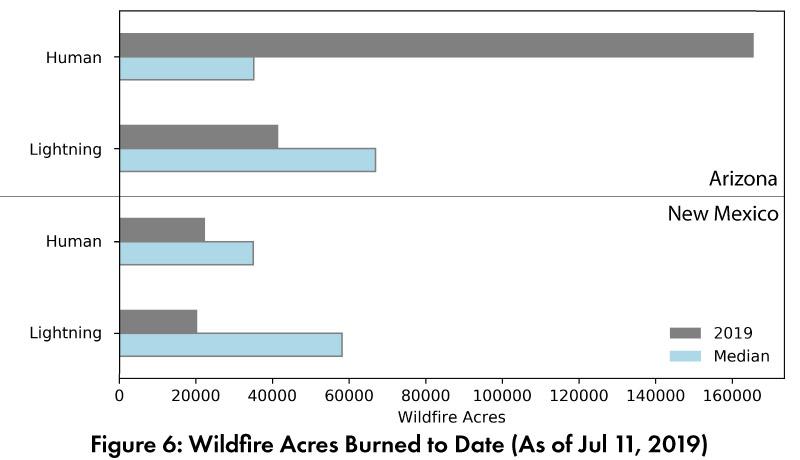
Wildfire, Health, and Safety: The onset of monsoon activity, including precipitation and increased humidity, has more or less tamped down elevated wildfire risk in much of the Southwest. The National Interagency Fire Center outlook for August calls for average fire risk across the region. In terms of wildfire acres burned, lightning caused fires in Arizona and New Mexico, as well as human caused fires in New Mexico, are all below their long term annual median acres burned for 2019 to date, while human caused fires in Arizona are well above the annual median acres burned (Fig. 6).
El Niño Tracker: After multiple months of outlooks that hinted at an El Niño event that might last through 2019 and into 2020, this event is currently forecast to return to ENSO-neutral conditions this summer (see ENSO-tracker for details).
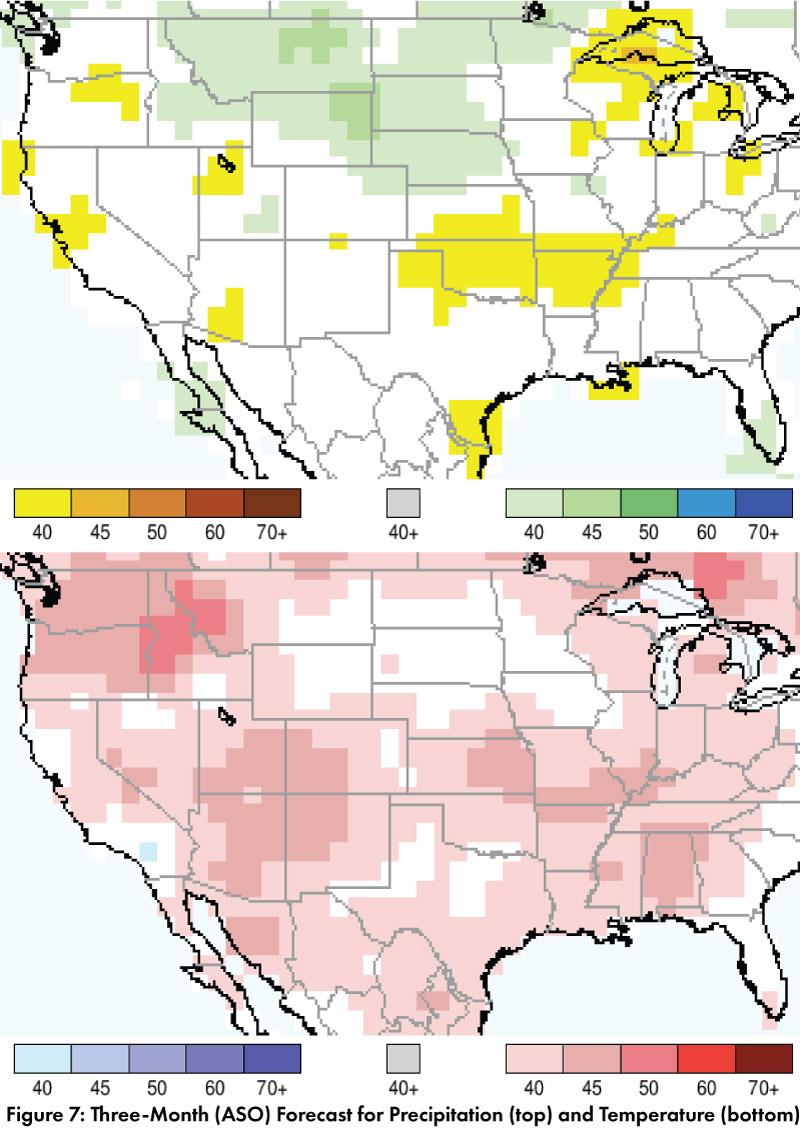
Precipitation and Temperature Forecast: The three-month outlook for August through October calls for increased chances of below-normal precipitation in parts of western Arizona, with equal chances of above- or below-normal precipitation in the rest of Arizona, New Mexico, west Texas, and northern Mexico (Fig. 7, top). The three-month temperature outlook calls for increased chances of above-normal temperatures across most of the U.S. Southwest and northern Mexico (Fig. 7, bottom).
Online Resources
- Figures 1, 3 - National Centers for Environmental Information - ncei.noaa.gov
- Figure 2, 6 - Climate Assessment for the Southwest - climas.arizona.edu
- Figure 4 - Western Regional Climate Center - wrcc.dri.edu
- Figure 5 - U.S. Drought Monitor - droughtmonitor.unl.edu
- Figure 7 - International Research Institute for Climate and Society - iri.columbia.edu