Understanding Urban Heat Vulnerability and the need for Resilient Design Practice
**Disclaimer: This blog post was adapted from a term paper for Dr. Christopher Scott's, Adaptation and Resilience in Water Resources Systems seminar GEOG 6960. **
The U.S. Southwest is rapidly becoming an urbanized region that is characterized by an intense urban heat island and summertime heat waves. At the city scale, high levels of urbanization in addition to local rising surface temperatures can affect the quality of life for several areas across residential communities, public and commercial spaces, etc. Heat within cities arises from different ways in which the built environment impacts energy exchange between the surface and atmosphere. This relationship causes unevenly distributed heat patterns across urban areas and some places tend to be hotter than others. Implementing green infrastructure shows promise to enhance the resiliency of urban areas (Benedict and McMahon, 2012). However, this type of infrastructure fails to distribute equally as it tends to be situated along access gradients based upon income, race and ethnicity (Zuniga-Teran, 2017). The absence of green infrastructure and green spaces in low-income, marginalized communities may further increase the vulnerability to heat and augment stress to communities that are already at greater risk. How then can we reduce vulnerability to heat in low-income communities situated in South Tucson? In order to answer this question, we would first need to understand the nature of the problem to begin with.
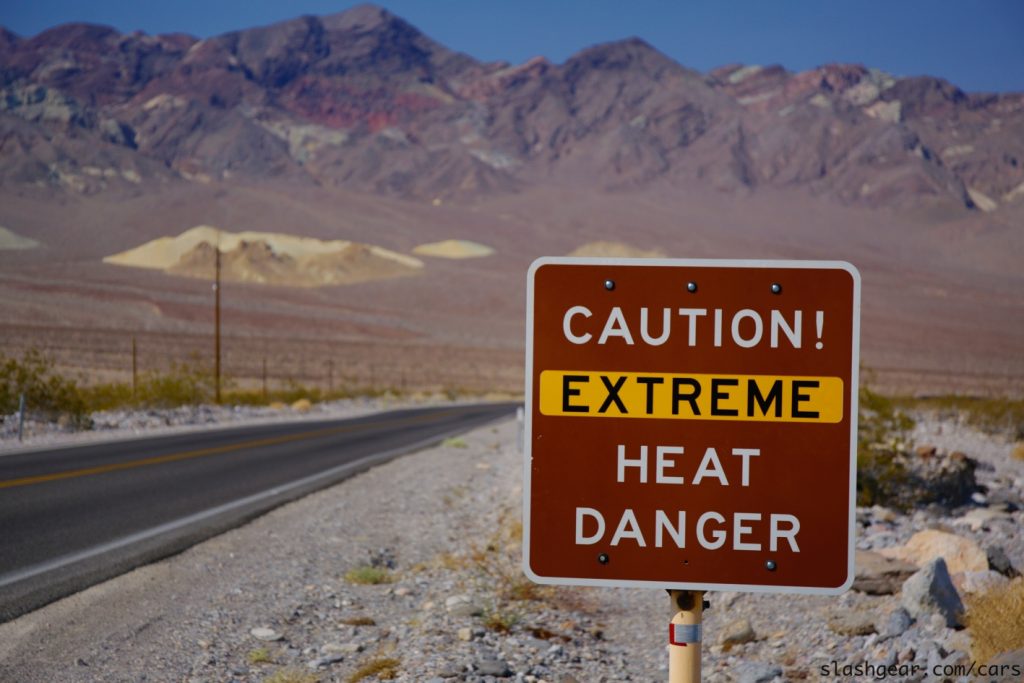
Image 1: Baaghi TV, Pakistan. International breaking news.
Within the Southwest, cities are experiencing an unprecedented change in global climate temperatures that consist of above average temperatures and below average precipitation, and is characterized by a few notable extremes, excess heat and lack of water. In addition to climate change impacts, urbanization has had a dramatic effect in increasing higher temperatures, which this process is commonly referred to as the Urban Heat Island Effect (UHI). UHI increases the temperatures in urban territories and intensifies and prolongs the effects of heat waves, causing an increase in human discomfort, energy consumption during the summer time, and other adverse impacts (Filho et al. 2018). Heat waves can pose a serious threat to vulnerable individuals such as elderly people, infants, and those with physical impairments or those who can’t afford mitigation measures.
Extreme heat events are increasing in frequency in large U.S. cities and are responsible for a greater annual number of climate-related fatalities, on average, than any other form of extreme weather (Gurshanov et al. 2013). Over the past years, temperatures in Tucson have increased dramatically. In 2016, Tucson reached an all-time high of 116 degrees Fahrenheit which followed an excessive heat warning and several local agencies and governments issued a notice to people to stay indoors and prevent dehydration and other precautions (O' Gara, 2017). Between June 19th and June 25th, Tucson International Airport registered 7 straight days with a high temperature of at least 109°. This is the third longest streak on record, matching the 7 day stretch back in June 1994. Tucson’s high temperature on June 20th, 116 degrees fahrenheit, was the 2nd hottest daytime high ever recorded (Beamish, 2017). In assessing areas at a local scale, studies have shown that high levels of heat can be attributed to urbanization and human induced activities. Human induced activities include heat generated by vehicle combustion and industrial processes, the conduction of heat through the materials fabrication of the walls within buildings, and the metabolic heat produced by humans.
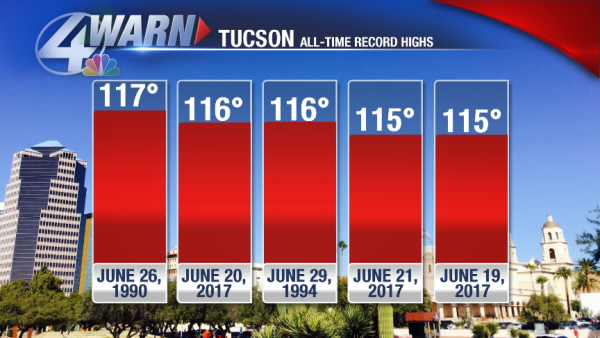
Image 2: Photo credit to Jeff Beamish. News 4 Tucson KVOA.COM. HEAT WAVE 2017: By the numbers
UHI results from growth of urban areas (urbanization), structural and land cover changes, as well as industrialization created by changes of heat absorbing surfaces, anthropogenic heat production, development of specific air circulation patterns (e.g. street canyons) and other factors (Filho et al. 2018). The U.S. has almost 81% of its population living in cities and towns. This high rate of urbanization will continue to increase the risk from heat waves for densely situated populations. Estimates from multiple sources including the United Nations predict that with the current rate of urbanization throughout this century, the world's population will reach 70% urban by 2050 and already, several metropolitan cities in the Southwest U.S. (Phoenix, Prescott and Tucson) are warming six times faster due to UHI (Zuniga-Teran, 2017 and Dalby, 2016). Despite the fact that climate change and global warming can be attributed to the rising global temperatures over the past 50 years, temperatures of the fastest warming U.S. cities are rising at a consistent rate with UHI supporting the claim that there is a strong relationship between the UHI and the urban configuration (Dalby, 2016).
Compared to rural areas, temperatures during nighttime in urban areas tend to be warmer, due to temperatures being trapped during the day. This is caused by multiple factors which include changes in thermal properties of surface materials, lack of evapotranspiration in urban areas and building heat blocked by buildings (Liang, 2012). Higher temperatures occur because dense concentrations of materials such as asphalt, concrete and buildings absorb more heat during the day and release it more slowly at night than natural ground cover such as soil and native vegetation (Dalby, 2016). Therefore, UHI can be reduced by implementing more passive natural systems that have high evapotranspiration rates: as the vegetation cover releases latent heat, green spaces can potentially cool surrounding areas, and can provide other ecological services to improve human comfort levels (Ahern, 2010).
Urban areas that lack sufficient and proper infrastructure are expected to be more vulnerable to the impacts of extreme events. Take for example, the Bravo Park Lane Neighborhood in South Tucson. The area tends to suffer from extreme heat during periods of above-average temperatures. The neighborhood lacks funding to provide for adequate infrastructure that could alleviate these impacts, such as investing in green infrastructure (G.I.) or creating green spaces the reduce temperatures. The area then fails to cope with excessive heat which translates to more energy used in buildings and subsequently higher energy bills. An assessment of the Bravo Park Lane Neighborhood was done in order to measure a communities’ vulnerability to heat. .
Since 2010, The Bravo Park Lane neighborhood has grown to a total population of 3,269 with a total of 1,504 household buildings (Statistic-atlas). Map 1 shows the current land use cover for the entire neighborhood. The neighborhood primarily consists of residential and commercial buildings structures built since the late 1980s that are accompanied with roads and impervious surface cover. Map 3 shows tree canopy data surrounding the neighborhood and reveals how the south side of Tucson contains less vegetation and tree canopies. Because vegetation is inversely related to heat, it is not surprising to see that the south side of the city is hotter, as shown in surface temperature Map 2. Due to high patterns of impervious cover land use and low adaptive capacity for the community to invest and initiate climate adaptation/mitigation programs, Bravo Park Lane Neighborhood can be considered a highly vulnerable community during extreme heat events. There is little participation of community to further augment greening street programs to offset UHI impacts towards the neirhborhood.
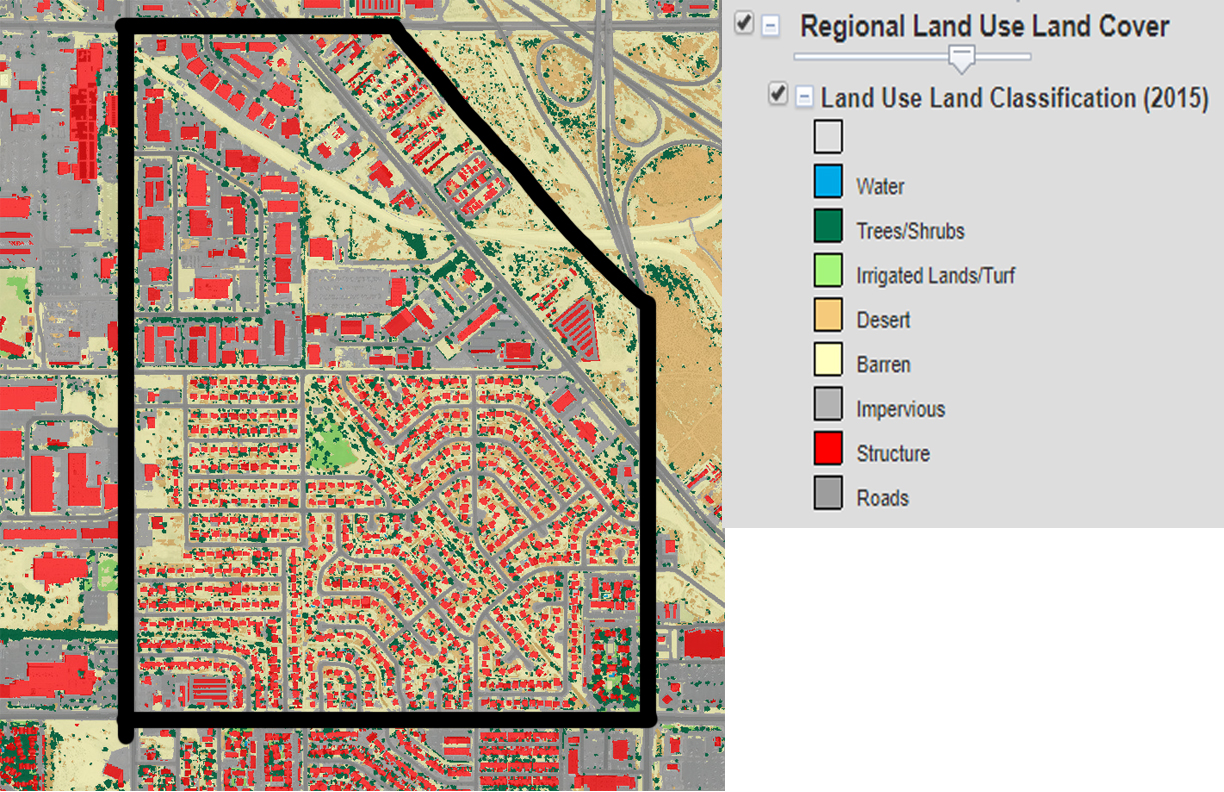
Map 1: Bravo Park Lane Neighborhood Regional Land Use Cover and Land Use Classification 2015 Map. PAG: Pima Association of Governments
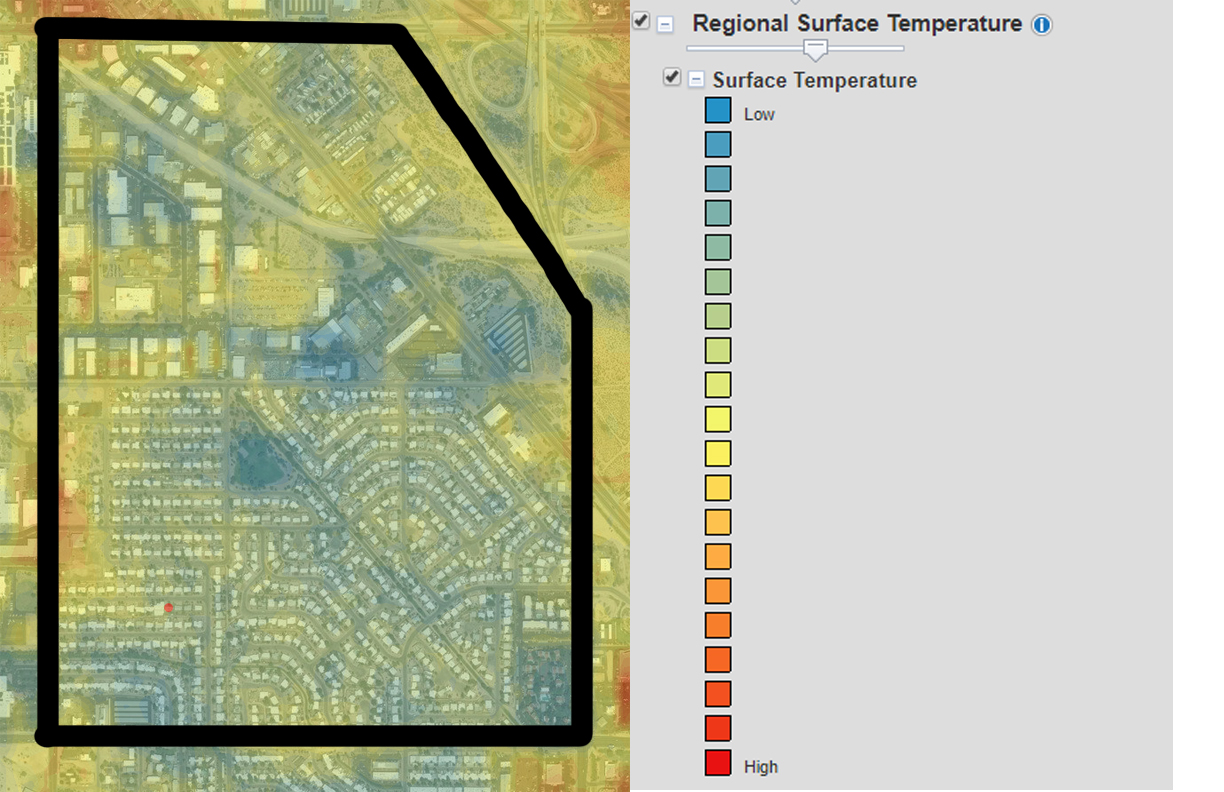
Map 2: Bravo Park Lane Neighborhood Surface Temperatures 2015 Map. PAG: Pima Association of Governments
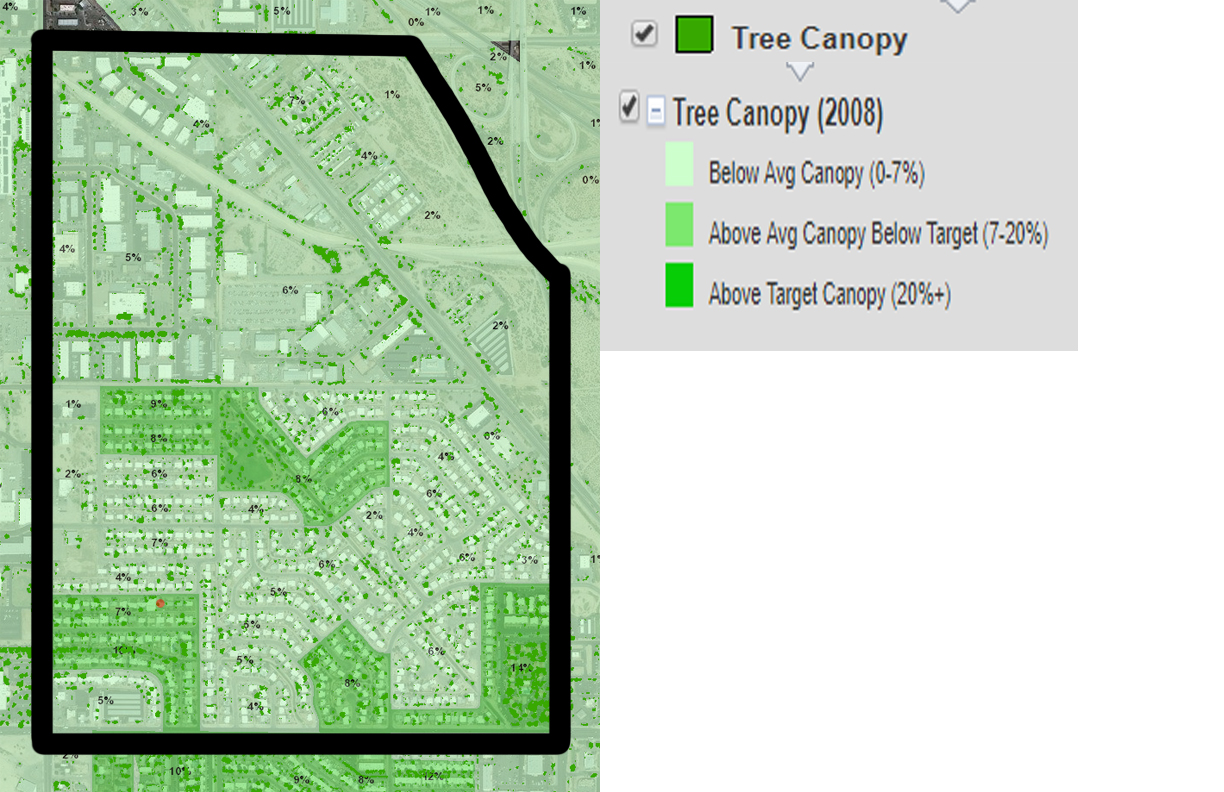
Map 3: Bravo Park Lane Neighborhood Tree Canopy Cover 2015 Map. PAG: Pima Association of Governments
Identifying specific factors that increase risk for some populations gives us a way to reduce exposure and vulnerability through adaptive actions. In some cases, simply increasing awareness of the risks that extreme heat poses to health can encourage people to take adaptive actions, such as going indoors or getting to a cooling center.
Especially in the case of Tucson, extreme heat during the summer months is a major public health issue (O'Brien et al. 2017). Efforts to mitigate heat in cities, such as the implementation of green infrastructure, including expansion of the urban tree canopy as well as revising design guidelines and principles for new construction, are increasing in the area. Moreover, based on the current urban fabric existing within tucson, there is an increasing demand for innovative design practices to combat the ever increasing vulnerability of cities to the negative impacts of urban heat. By reviewing the phenomenon that is the urban heat island effect and how it affects individual cities, we can begin developing alternative and effective strategies in adaptation and mitigation. Lessons that we can take from the UHI is that traditional, static built environment forms are no longer adequate nor efficient in a changing climatic world. Designers and planners are then tasked to propose innovative and improved open space designs that practice a greater care with the choices of construction materials in properties.
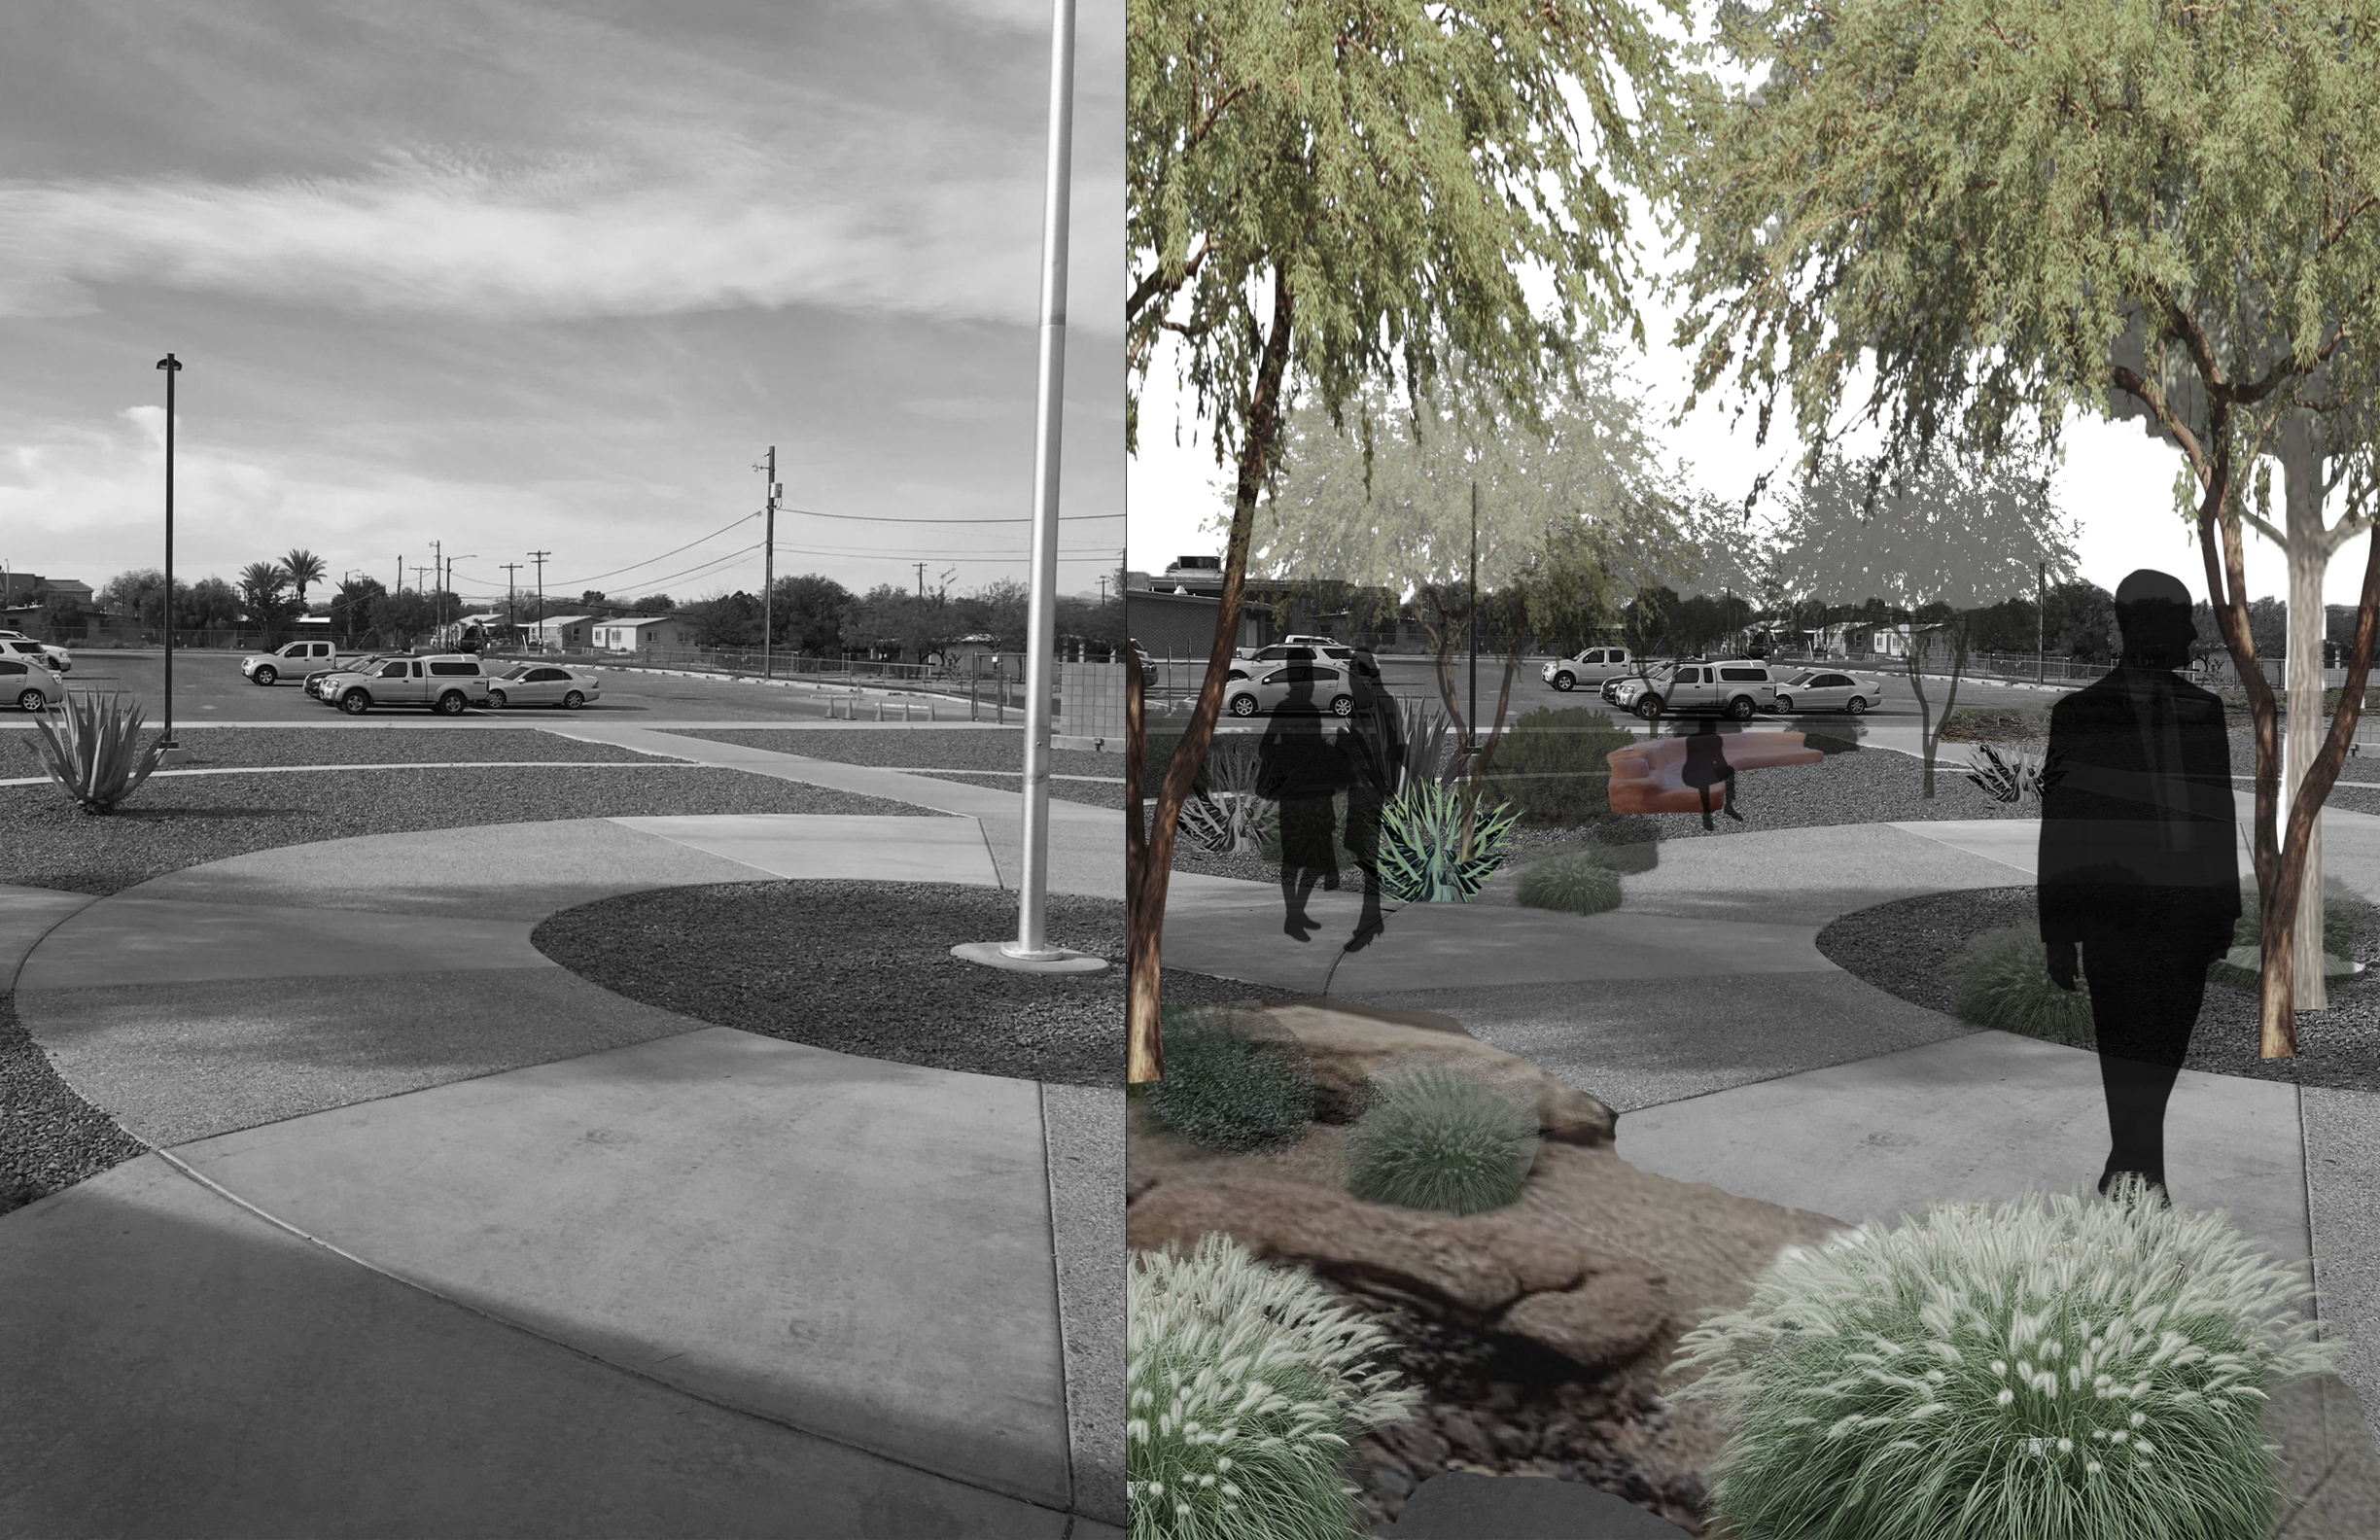
Image 2: Reimagining the STAR High School entrance in South Tucson, a high risk community to extreme heat events. This design strives to mitigate the extreme urban heat island effect present on the site and in the surrounding area by decreasing reflective materials and providing increased shade where these materials are necessary.
References
-
Ahern, J. 2010. Planning and design for sustainable and resilient cities: theories, strategies and best practices for green infrastructure
-
Benedict, M., & McMahon, E. (2012). Green Infrastructure: Linking Landscapes and Communities. The Island Press.
-
Beamish, J. 2017. Heat wave 2017: By the numbers. News 4 Tucson. KVOA.com.
-
Dalby, T. 2016. Understanding the impact of urban heat island effect in the southwestern u.s. Strategic Solar energy.
-
Filho, W., Echevarria Icaza, L., Neht, A., Klavins, M., & Morgan, E. (2018). Coping with the impacts of urban heat islands. A literature based study on understanding urban heat vulnerability and the need for resilience in cities in a global climate change context. Journal Of Cleaner Production, 171, 1140-1149. doi: 10.1016/j.jclepro.2017.10.086
-
Gershunov, A., B. Rajagopalan, J. Overpeck, K. Guirguis, D. Cayan, M. Hughes, M. Dettinger, C. Castro, R. E. Schwartz, M. Anderson, A. J. Ray, J. Barsugli, T. Cavazos, and M .Alexander. 2013. “Future Climate: Projected Extremes.” In Assessment of Climate Change in the Southwest United States: A Report Prepared for the National Climate Assessment, edited by G. Garfin, A. Jardine,R. Merideth, M. Black, and S. LeRoy, 126–147. A report by the Southwest Climate Alliance. Washington, DC: Island Press.
-
Liang, S., Li Xiaowen, J. Wang. 2012. Advanced remote sensing. Chapter 21-Land cover and land use changes. Pgs. 703-772.
- O’Brien, Jonathan., Fanqui, J., Khan, R., Wilson, C. (2017). Assessing Urban Heat as it Relates to Social Vulnerability and Land Use Changes in Las Cruces, New Mexico. Develop.larc.nasa.gov
- O’ Gara, Nick. 2017. Tucson heat wave: one record tied, one broken. Arizona Public Media news article. Available at: https://news.azpm.org/p/news articles/2017/6/20/112731-tucson-heat-wave-one-record-tied-one-broken/
-
Zuniga-Teran, A. and A. K. Gerlak. (2017). Engaging low-income communities in the development of a greenway in Tucson, Arizona. International Water Security Network.