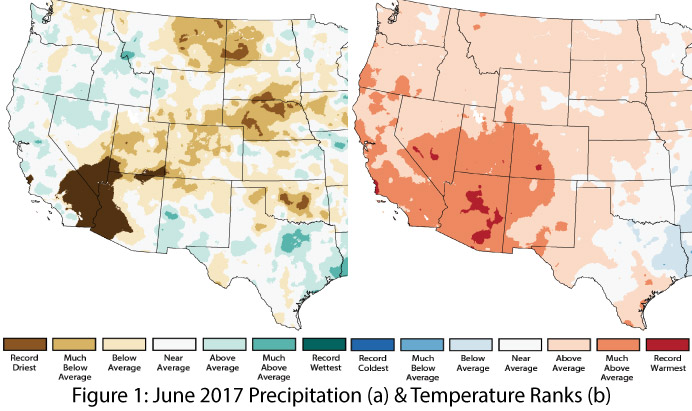
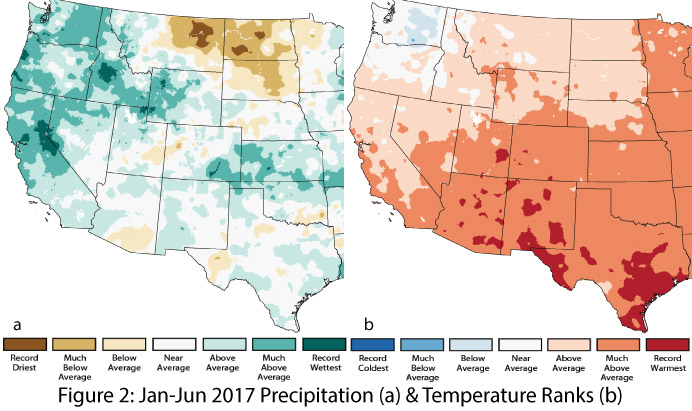
Precipitation and Temperature: June precipitation ranged from record driest to near average in Arizona, while in New Mexico, precipitation ranged from much-below to much-above average (Fig. 1a). This difference reflects the seasonal progression of monsoon activity in the Southwest—it typically starts earlier in New Mexico and progresses westward—as well as the relatively late start to monsoon activity observed in much of Arizona this year. June temperatures ranged from much-above average to record warmest in Arizona and from above average to much-above average in New Mexico (Fig. 1b). A region-wide heat wave that struck in mid-to-late June helped drag up the averages, setting a number of daily high records across Arizona. Year-to-date precipitation ranks reveal average to above-average precipitation in all of New Mexico and much of Arizona, with a pocket of below-average precipitation in southeast Arizona (Fig. 2a). Year-to-date temperatures reveal much-above-average to record-warmest conditions in both Arizona and New Mexico (Fig. 2b).
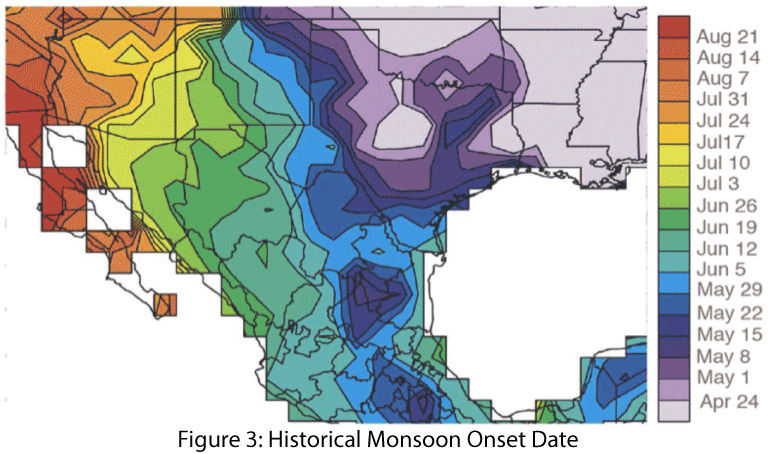
Monsoon Tracker: The official start of the monsoon was June 15, but widespread activity started relatively late this year (see monsoon discussion), especially in southern Arizona. There, numerous storms in mid-July brought widespread and frequent precipitation activity, boosting the percent normal monsoon precipitation in several locations (See Figs. 1a-b on SW Monsoon Tracker). New Mexico had a comparatively earlier start to monsoon activity, which is expected given the typical spatiotemporal progression of the monsoon (Fig. 3), and has seen more steady and widespread monsoon activity, as evidenced by the percent of days with rain (see Figs. 2a-b on SW Monsoon Tracker).
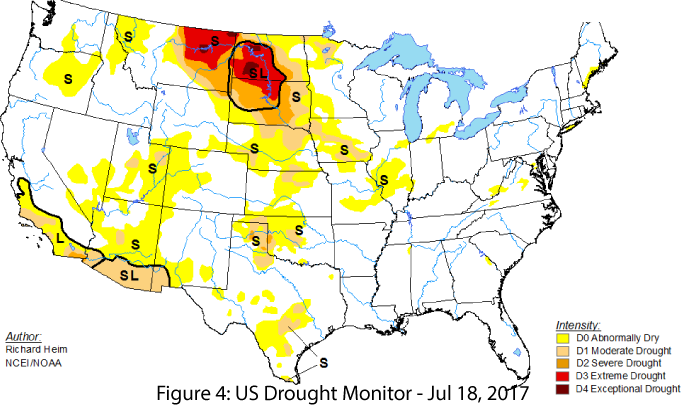
Drought & Water Supply: Drought conditions on the U.S. drought monitor have expanded in the past few weeks, with most of Arizona recording either D0 (abnormally dry) or D1 (moderate drought) conditions. This reflects short-term precipitation deficits in the upper two-thirds of Arizona, as well as short- and long-term deficits in the lower third, a pattern that also extends to the southwestern corner of New Mexico. Most of the rest of New Mexico has no drought designation (Fig. 4).
Wildfire: Arizona is experiencing an active fire season in 2017, with nearly 350,000 acres of wildfire across the state. A number of factors contributed to the increased activity in Arizona this year, including abundant fine fuels, below-average winter precipitation, above-average temperatures, and a later-than-average start to the monsoon and its increased precipitation and relative humidity. New Mexico has had less fire activity, with approximately 123,000 acres burned, largely attributed to the earlier arrival of monsoon conditions.
El Niño Southern Oscillation: Most models and forecasts continue to suggest the most likely outcome for 2017 is ENSO neutral conditions through winter 2017-2018 (50-55 percent chance). The chances of an El Niño event do remain elevated (35-45 percent chance) compared to long-term averages, however, effectively reducing the chance of a La Niña event to near zero.
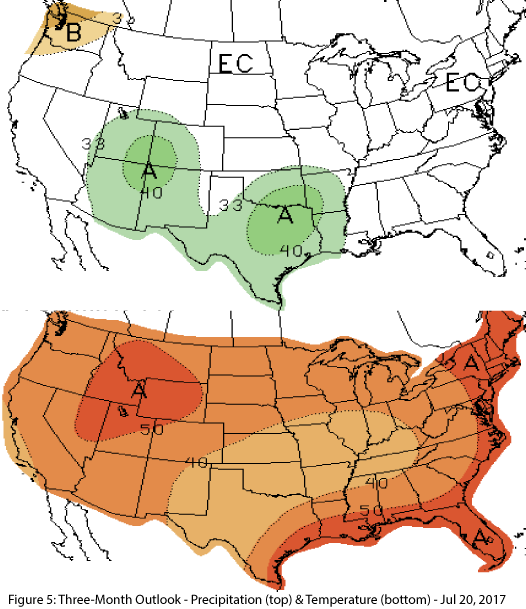
Precipitation and Temperature Forecast: The July 20 NOAA Climate Prediction Center’s outlook for August calls for increased chance of above-average precipitation in Arizona and New Mexico, and equal chances of above- or below -average temperatures in most of Arizona and New Mexico. The three-month outlook for August through October calls for increased chance of above-average precipitation in Arizona and New Mexico (Fig. 5, top). Increased chances of above-normal temperatures are forecast for the entire United States (Fig. 5, bottom).