Monthly Precipitation and Temperature: September precipitation in Arizona ranged from much below average in the north, to much above average in the south, while most of New Mexico was average to below average (Fig. 1a). September temperatures were mostly average to much above average in Arizona and mostly much above average to record warmest in New Mexico (Fig. 1b). The daily average temperature anomalies for Sept 1 – Oct 15 (Fig. 2) highlight the fluctuations at select stations around the region.
Annual Precipitation and Temperature: Total precipitation for 2019 (Jan-Sept) in Arizona was mostly average to above average, with some below average in the four corners region, while New Mexico was drier with average to below average across most of the state, along with some pockets of much below average conditions (Fig. 3a). Mean temperatures in 2019 so far are mostly above average in Arizona and above average to much above average in New Mexico (Fig. 3b).
Drought: Water year precipitation (Oct 1 2018 – Sept 30 2019) was mostly normal to above normal across most of Arizona and much of northeastern New Mexico, while parts of eastern Arizona and south-central and northwestern New Mexico were normal to below normal (Fig. 4). These totals are buoyed by tropical storm activity in Oct 2018 and Sept 2019, and may be skewing some characterizations of longer term precipitation. Given recent conditions and the below average monsoon, drought has returned to much of Arizona and western New Mexico in the Oct 8 U.S. Drought Monitor (USDM) (Fig. 5). This designation is leaning more heavily on recent below average monsoon precipitation, despite water year precipitation totals.
Tropical Storm Activity: The eastern North Pacific hurricane season has been near normal, with 16 named storms as of Oct. 16 (Fig. 6), including four major hurricanes (category 4 or above), with the average through this date at approximately 15 named storms and 4 major hurricanes. The Accumulated Cyclonic Energy (ACE) to date is 95 (for comparison, last year this time ACE was 295), while the average to date is approximately 120. Recent notable events include heavy precipitation linked to TS Lorena and TS Mario, which funneled moisture into a cutoff low in mid-to-late September. This brought highly variable but at times intense storms to southern Arizona, including some supercell formation in central and eastern Arizona. Given the meager monsoon, their impacts are visible on the percent of normal maps (see Monsoon Recap).
ENSO Update: Oceanic and atmospheric conditions are generally consistent with an ENSO-neutral outlook for 2019 and into 2020 (see ENSO-tracker for details).
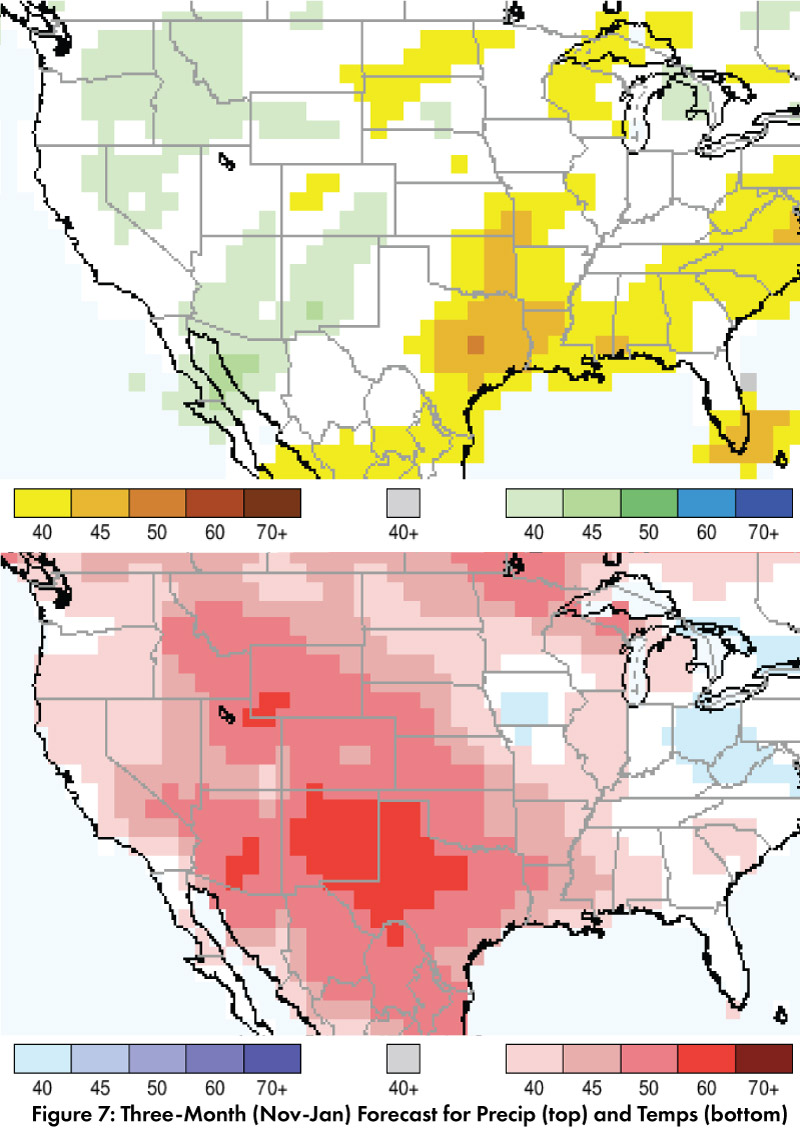
Precipitation and Temperature Forecast: The three-month outlook for November through January calls for increased chances of above-normal precipitation in much of Arizona, New Mexico, and northwestern Mexico (Fig. 7, top). The three-month temperature outlook calls for increased chances of above-normal temperatures across the U.S. Southwest and northern Mexico (Fig. 7, bottom).