Precipitation & Temperature: September precipitation was much-below average to below average across central and southeastern Arizona and southwestern New Mexico, while northeastern New Mexico recorded above-average to much-above-average precipitation for the month (Fig. 1a). September temperatures were average to much-above average in New Mexico, and below average to much-above average in Arizona (Fig. 1b). October temperatures to date have been quite warm, especially in the southern portions of Arizona and New Mexico. Year-to-date precipitation ranges widely from much-below average in southeastern Arizona to much-above average to record wettest in northeastern New Mexico (Fig. 2a). January through September temperatures have been consistently warmer than average, with nearly all of Arizona and New Mexico recording much-above average temperatures, including small pockets of record-warmest conditions in both states (Fig. 2b).
Monsoon Tracker: Persistent dry conditions in September meant 2017 monsoon precipitation totals saw little change in the last weeks of the monsoon, especially in Arizona. New Mexico recorded a late-season surge, with heavy rainfall observed in a number of locales just in time to be counted in the seasonal totals (Figs. 3, 5a; see Monsoon Tracker for more details).
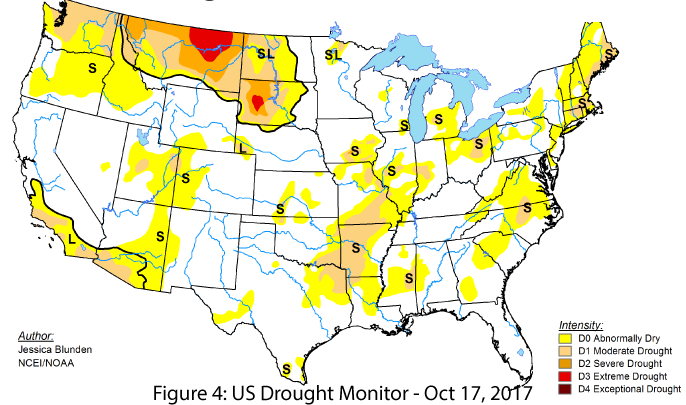
Drought & Water Supply: Arizona has seen a return to short-term drought designation (D0: abnormally dry) in eastern and southeastern regions. This designation, in addition to the long-term drought designations (D0: abnormally dry and D1: moderate drought) that are persisting along the U.S.-Mexico border in southwest Arizona, mean that well over 50 percent of Arizona had some form of drought designation as of October 2017. New Mexico is nearly free of drought designation, with just one small area of D0 (abnormally dry) in the western part of the state (Fig. 4; also see Arizona and New Mexico reservoir storage and water supply).
Water Year 2017: Water-year (Oct 2016 – Sept 2017) precipitation was normal to above normal in most of New Mexico, while Arizona ranged from well-below normal in southern and eastern areas to above normal in the northwest part of the state (Fig. 5b). Notably, the pattern of below-normal precipitation extended into the Upper Basin of the Colorado River (in Utah and Colorado), an important fact to monitor going into this next winter and water year given the strong influence that drought in the Upper Basin can have on Lower Basin water availability and management.
El Niño Southern Oscillation: Current conditions are generally in the range of ENSO-neutral, while seasonal outlooks and forecast models continue to suggest La Niña as the most likely outcome this winter (See ENSO Tracker for more details).
Tropical Storms: The eastern Pacific tropical storm season has been active in 2017 with 17 named storms, including nine hurricanes of which four were major (greater than category 3), and the season is not yet over. This is in line with the seasonal outlook for 2017, which predicted 14-20 named storms, 6-11 hurricanes and 3-7 major hurricanes. Despite an average to above-average number of storms, they have not been active in driving moisture into the Southwest. This is one factor that has contributed to the drier-than-average conditions observed in late August and most of September, which often sees increased precipitation linked to tropical storm activity.
Precipitation & Temperature Forecast: The three-month outlook for October through December calls for increased chances of below-average precipitation for most of Arizona and New Mexico (Fig. 6, top), and increased chances of above-normal temperatures for the entire southwestern United States (Fig. 6, bottom).