Precipitation: In the past 30 days, precipitation was below average in much of southern Arizona, above average in portions of northern Arizona and southern New Mexico, and near normal across much of the rest of the region (Fig. 1). Precipitation totals for the water year (since Oct. 1) are below average across all of Arizona and most of New Mexico and are even worse in other western areas; California, the Pacific Northwest, and the Intermountain West are recording significantly below-average winter precipitation (Fig. 2).
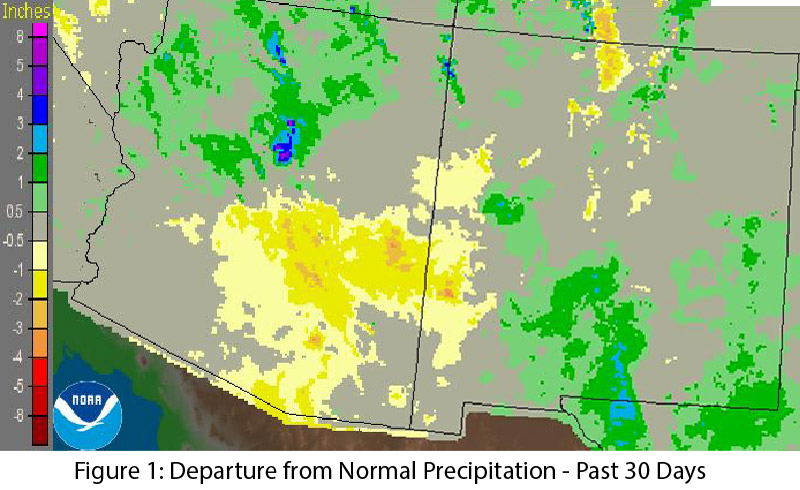
Image Source - NOAA/NWS - Advanced Hydrologic Prediction Service
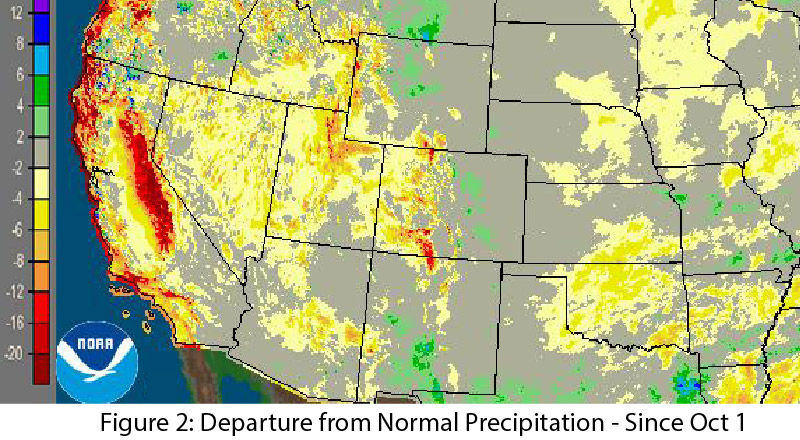
Image Source - NOAA/NWS - Advanced Hydrologic Prediction Service
Temperature: In the past 30 days, temperatures in nearly all of Arizona ranged from 0 to 6 degrees F above average. The western half of New Mexico was warmer than average, while the eastern half was cooler (Fig. 3). Regionally, winter 2014-2015 has seen a continuation of well above-average temperatures across much of the western U.S.
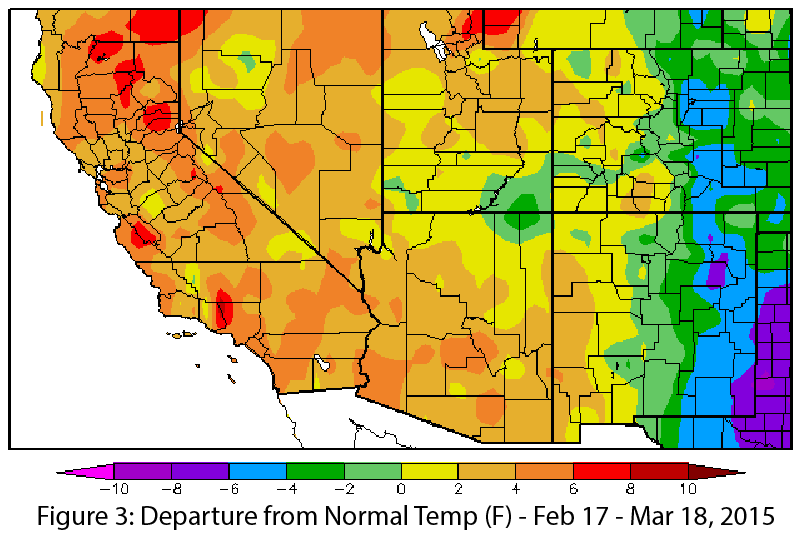
Image Source - High Plains Regional Climate Center
Snowpack & Water Supply: Snow water equivalent (SWE) is very low in most of Arizona (ranging from 2 to 74 percent of average) and much of New Mexico (ranging from 11 to 111 percent of average), although Califonia and the Pacific Northwest are at even lower levels (Fig. 4). Well above-average temperatures continue to have a significant effect on snowpack, pushing the snowline higher and driving early snowmelt runoff. In January, total reservoir storage was 45 percent in Arizona (compared to 46 percent last year) and 24 percent in New Mexico (compared to 23 percent last year) (see reservoir storage on page 4, for details).
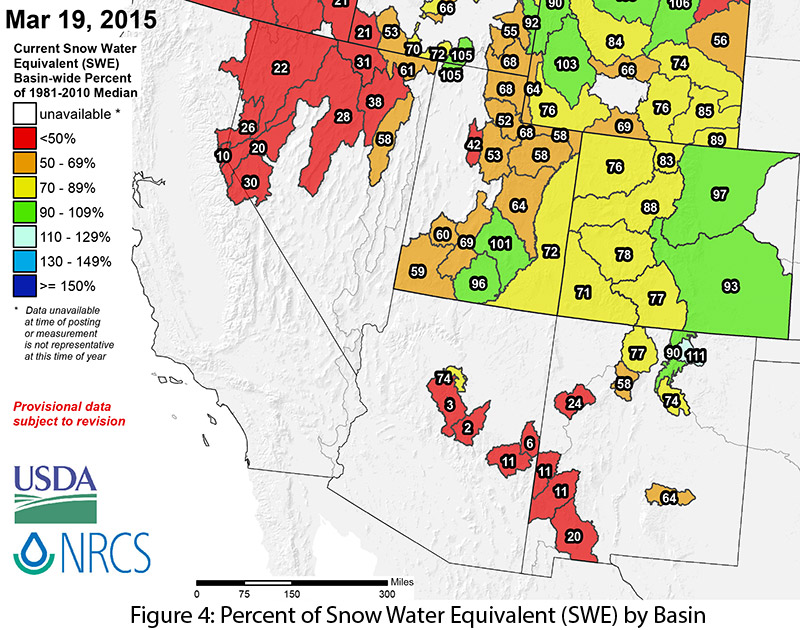
Image Source - Natural Resources Conservation Service - NRCS
Drought: Long-term drought conditions persist across the West, and the U.S. Drought Monitor continues to document long-term drought conditions across much of Arizona and New Mexico (Fig. 5).
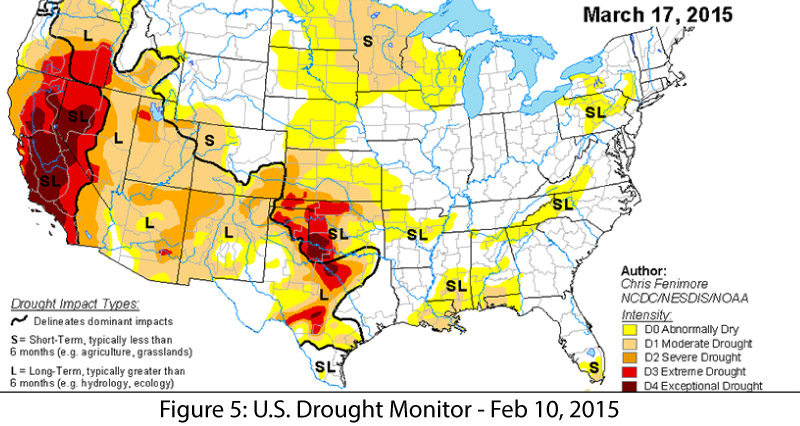
Image Source - National Drought Mitigation Center
Plant Ecology & Human Health: Above-average temperatures and winter rains jumpstarted plant activity across the region, and the Southwest is experiencing a banner year for wildflowers. This beauty comes at a cost; pollen levels are high enough to affect most allergy sufferers and are expected to remain that way through the spring.
El Niño: El Niño finally arrived, and will likely remain a weak event this spring and into summer. Forecasts suggest El Niño could escalate to a moderate to strong event in 2015-2016 (see ENSO Tracker on page 3).
Precipitation & Temperature Forecasts: The Mar. 19 NOAA-Climate Prediction Center seasonal outlook continues to predict above-average precipitation this spring for most of the Southwest. Temperature forecasts remain split across the region, with elevated chances for above-average temperatures along the West Coast and eastward into Arizona (and the western U.S.) and increased chances for below-average temperatures across Texas and into New Mexico (Fig. 6).
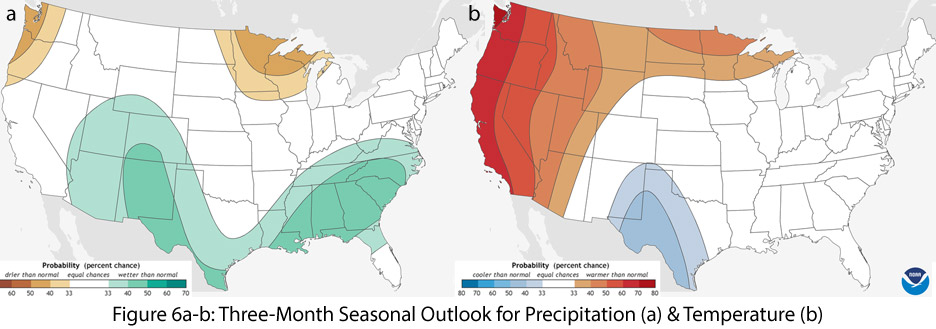
Image Source - NOAA-Climate Prediction Center
Streamflow Forecasts: The Mar. 1 forecast for the Colorado, Rio Grande, and Arkansas river basins projects well below-average streamflow for most of Arizona and New Mexico, with the exception of north-central New Mexico and a few isolated locations in Arizona (Fig. 7).
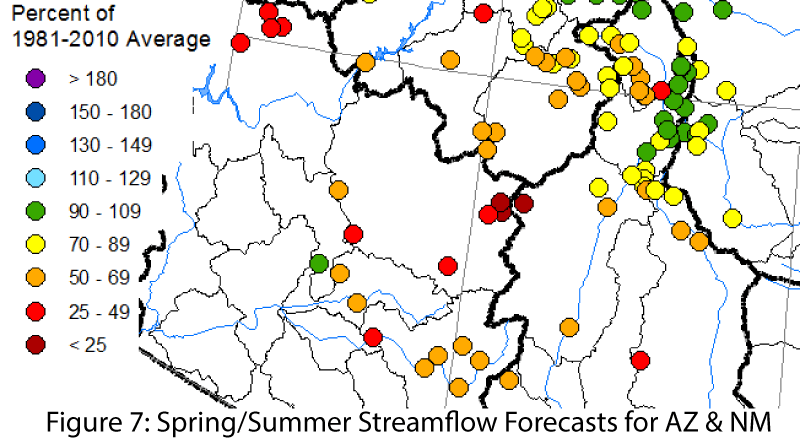
Image Source - Natural Resources Conservation Service - NRCS