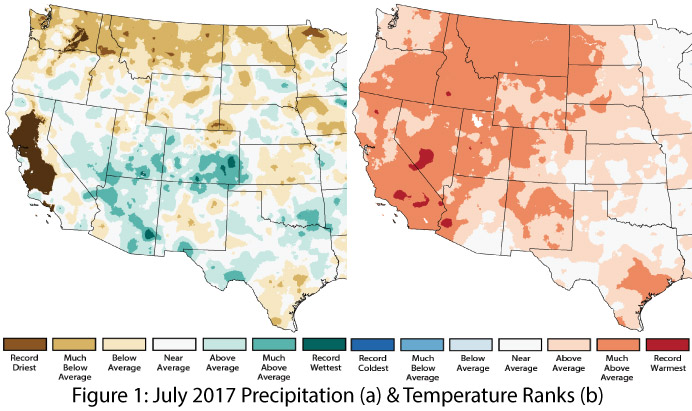
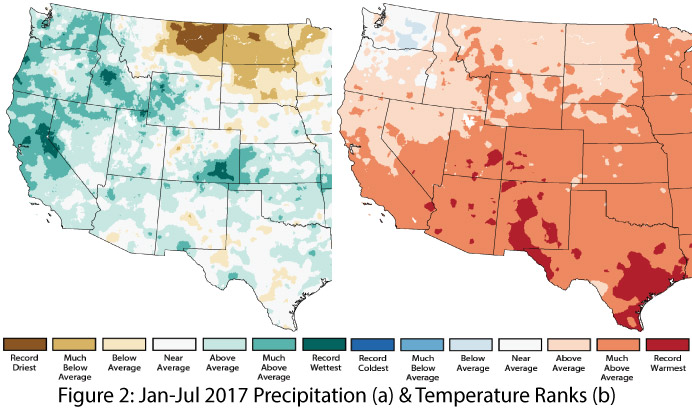
Precipitation and Temperature: July precipitation ranged from below average in the southwest corner of Arizona to average to much-above average across the rest of the state (Fig. 1a). Central New Mexico recorded mostly below-average precipitation in July, while the northern and southwestern portions of the state recorded average to much-above average precipitation (Fig. 1a). July temperatures were average to much-above average in Arizona and New Mexico (Fig. 1b), although regular monsoon events helped tamp down daily average temperatures in southeastern Arizona and southwestern New Mexico. Year-to-date precipitation ranks reveal mostly average to above-average precipitation in Arizona and New Mexico, with drier pockets in the borderlands region of Arizona and in central and southeastern New Mexico (Fig. 2a). Year-to-date temperature ranks are much-above average across the Southwest (Fig. 2b), with small areas of Arizona and much of the Rio Grande Basin in New Mexico recording record-warm yearly average temperatures (Jan-July 2017).
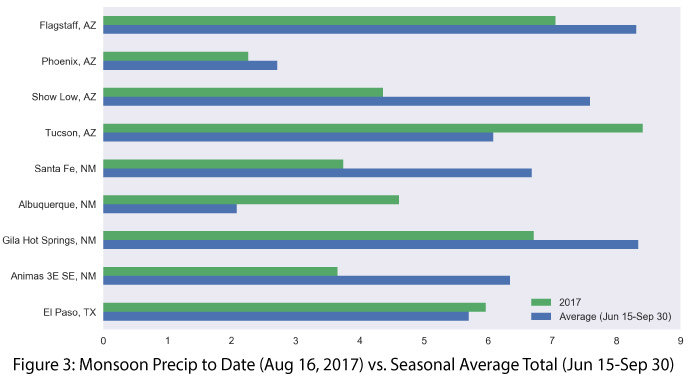
Monsoon Tracker: The monsoon started a bit later than average in 2017 but more than made up for the delayed start with numerous precipitation events throughout much of July and early August (see Monsoon Tracker for details). Notably, Tucson recorded its wettest July on record and second-wettest month on record, and it and many other stations across the region have surpassed their normal cumulative values, with some approaching or even exceeding their seasonal (June 15 – Sept. 30) climatological average (Fig. 3).
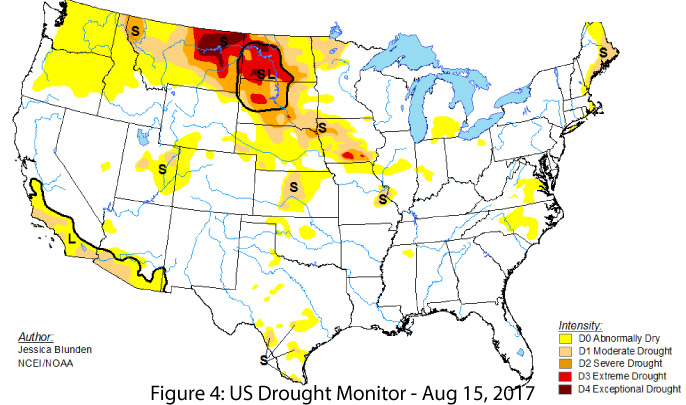
Drought & Water Supply: With monsoon precipitation catching up in the northern halves of Arizona and New Mexico, the U.S. Drought Monitor (USDM) has removed those regions from the short-term drought designation of the previous month. However, the borderlands region of southern Arizona remains designated as either D0 (abnormally dry) or D1 (moderate drought), emphasizing long-term drought conditions linked to below-average winter precipitation that are not typically ameliorated by monsoon precipitation (Fig. 4).
Health & Environmental Safety: Wildfire season is effectively over in Arizona and New Mexico, with monsoon precipitation and increased relative humidity tamping down fire risk across the region. Wildfire totals for the 2017 season are approximately 370,000 acres burned in Arizona (roughly 220,000 acres attributed to lightning ignition and the remainder to human causes), and approximately 128,000 acres burned in New Mexico (105,000 acres due to lightning and 23,000 acres from humans). With the return of the monsoon, the region has also seen an uptick in pollen counts from plants that take advantage of seasonal moisture: chenopod and ragweed pollen are particularly severe following abundant monsoon precipitation.
El Niño Southern Oscillation: Models and forecasts continue to suggest the most likely outcome is ENSO-neutral conditions through winter 2017-2018 (85 percent chance through the fall, then 55 percent chance over winter - See ENSO Tracker for details). The chances of El Niño or La Niña this winter are fairly low, at 15-20 percent and 25-30 percent, respectively.
Precipitation and Temperature Forecast: The Aug. 17 NOAA Climate Prediction Center’s outlook for September calls for equal chances of above- or below-average precipitation in Arizona and New Mexico, and increased chances of above-average temperatures in most of Arizona. The three-month outlook for September through November calls for equal chances of above- or below-average precipitation in Arizona and New Mexico (Fig. 5, top). Increased chances of above-normal temperatures are forecast for the entire United States (Fig. 5, bottom).