Southwest Climate Outlook - El Niño Tracker - May 2019
Seasonal outlooks highlight persistent sea surface temperature (SST) anomalies consistent with a weak El Niño event (Figs. 1-2), while other atmospheric and oceanic indicators such as convective anomalies and sub-surface temperatures are less definitive. The so-called ‘spring predictability barrier’ further limits certainty. Forecast discussions focus on how long the event will last and the potential for a second year of El Niño.
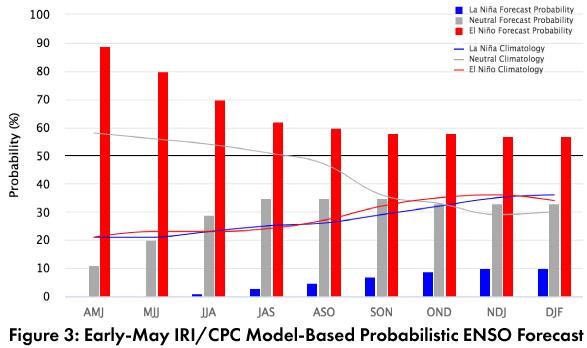
On May 9, the NOAA Climate Prediction Center (CPC) maintained their El Niño advisory, identifying that SSTs were consistent with El Niño even while other indicators were less definitive. Their outlook maintained a 70-percent chance of El Niño lasting through summer, and 55- to 60-percent of lasting through fall. On May 9, the International Research Institute (IRI) issued an ENSO Quick Look (Fig. 3), highlighting above-average SSTs and warm subsurface waters, although they noted a decline in the positive sub-surface anomalies over the last few months. On May 10, the Japanese Meteorological Agency (JMA) noted deviations from typical El Niño conditions in the atmosphere, but based on SSTs, they called for an 80-percent chance of the event lasting until summer, and a 60-percent chance to last until fall. On May 14, the Australian Bureau of Meteorology moved their ENSO Outlook to “watch” status (down from “alert”), calling for a 50-percent chance of an El Niño event sometime in 2019. The North American Multi-Model Ensemble (NMME) points toward a weak El Niño lasting into fall 2019 (Fig. 4).
Summary: El Niño conditions are in the range of a weak event, but it is difficult to nail down its longevity. It might be on the way out by the end of summer, it might extend into Fall, or it might even last into 2020. With El Niño conditions expected to remain for at least the rest of summer, there are a few associations of note. The first is enhanced northern Pacific tropical storm activity, which could see tropical storms increase our warm season precipitation totals in direct ways via storms that push into the region or that provide additional moisture and instability that enhances monsoon activity. This influence is typically associated with the latter half of the monsoon and into fall, but tropical storms have augmented regional precipitation totals in late May and early June (e.g. TS Bud, last year). El Niño conditions over summer are also associated with a delayed onset of monsoon activity, but this link is tenuous given the small sample size. El Niño sends us mixed signals for summer seasonal outlooks, and provides little to improve our understanding about the timing and intensity of tropical storm activity and monsoon precipitation.
Online Resources
- Figure 1 - Australian Bureau of Meteorology - bom.gov.au/climate/enso
- Figure 2 - NOAA - Climate Prediction Center - cpc.ncep.noaa.gov
- Figure 3 - International Research Institute for Climate and Society - iri.columbia.edu
- Figure 4 - NOAA - Climate Prediction Center - cpc.ncep.noaa.gov


