Southwest Climate Outlook January 2021 - Climate Summary
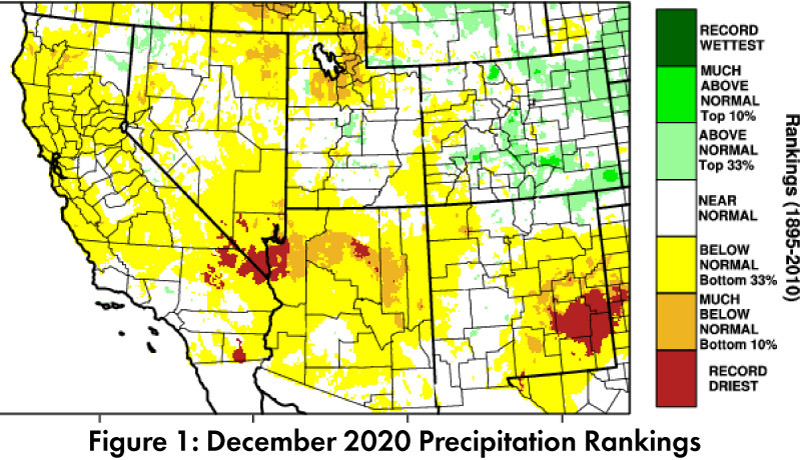
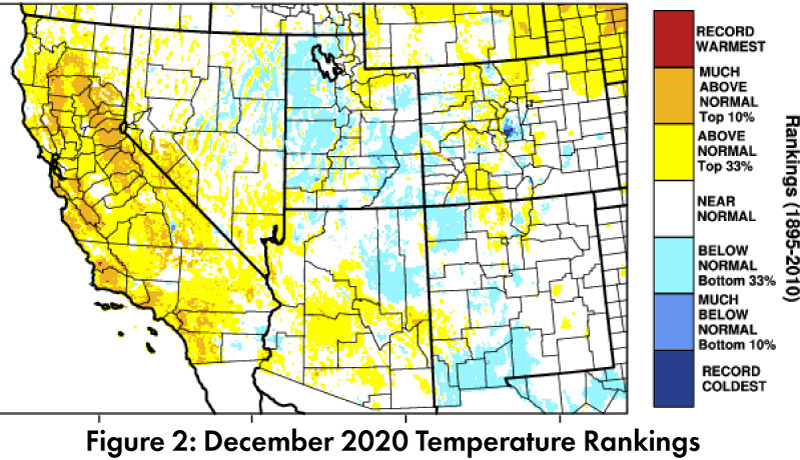
December Precipitation and Temperature: Precipitation was near normal to record driest across most of Arizona and New Mexico in December (Fig. 1), while temperatures ranged between above and below normal in most of Arizona and New Mexico (Fig. 2).
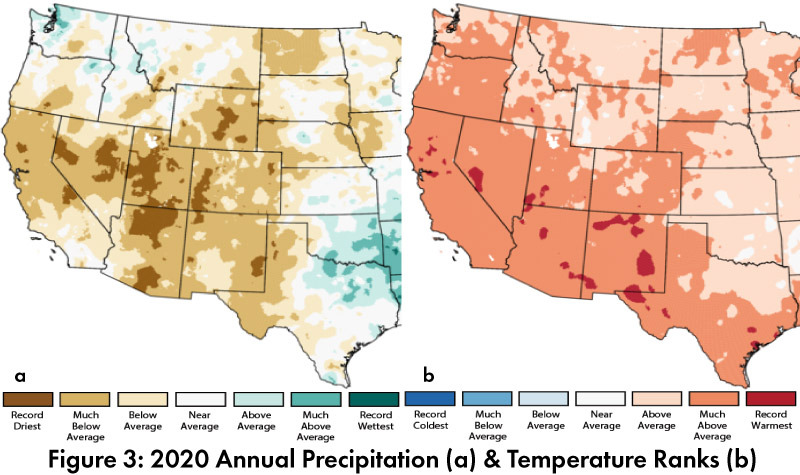
2020 Precipitation and Temperature: Annual precipitation totals ranged between below average and record driest in Arizona and New Mexico (Fig. 3a). Mean annual temperature was much above average in most of the Southwest, with a few pockets of record warmest (Fig. 3b). See Fig. 1 highlighting daily, record, and normal high and low temperatures, for select weather stations from around the region.
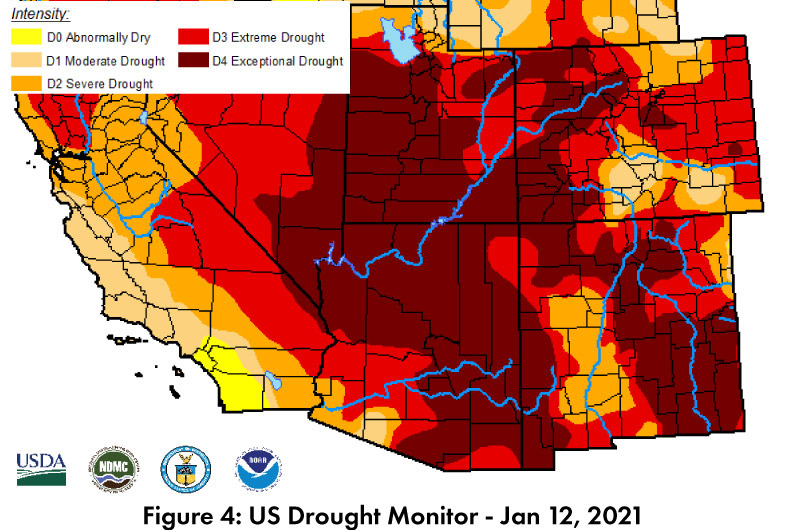
Drought: The Jan 12 U.S. Drought Monitor (USDM) for the U.S. Southwest ranges from moderate drought (D1) to exceptional drought (D4), but a vast majority of the region is in D3 or D4 (Fig. 4).
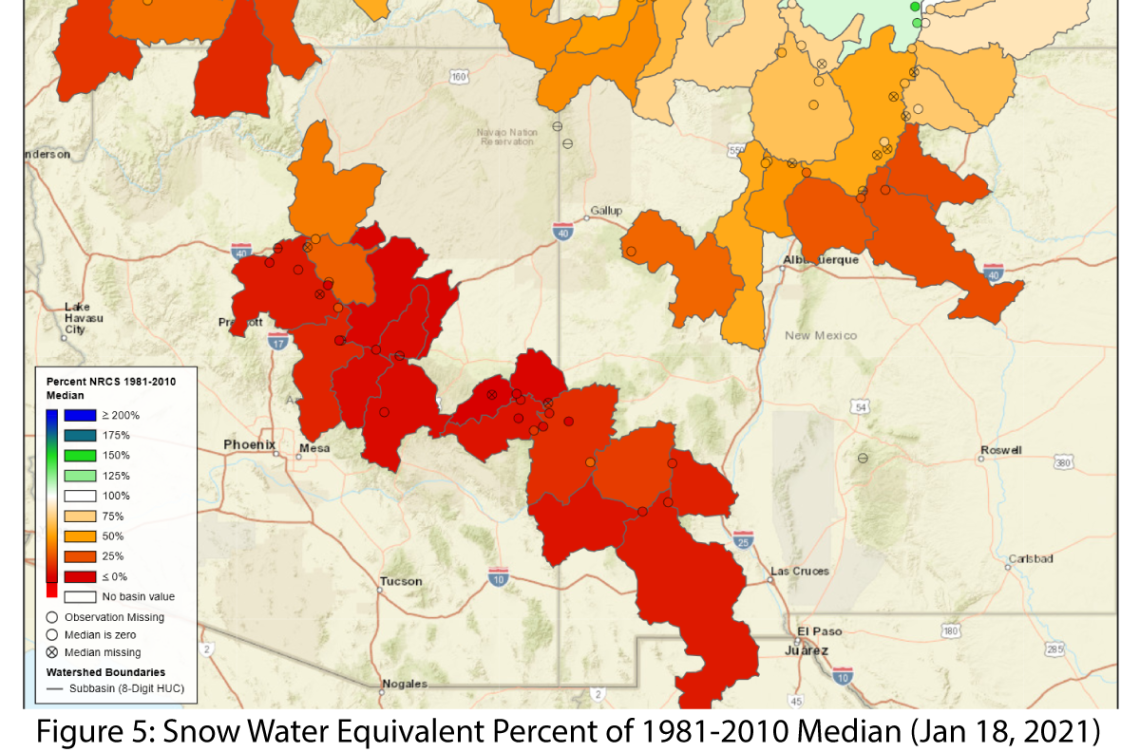
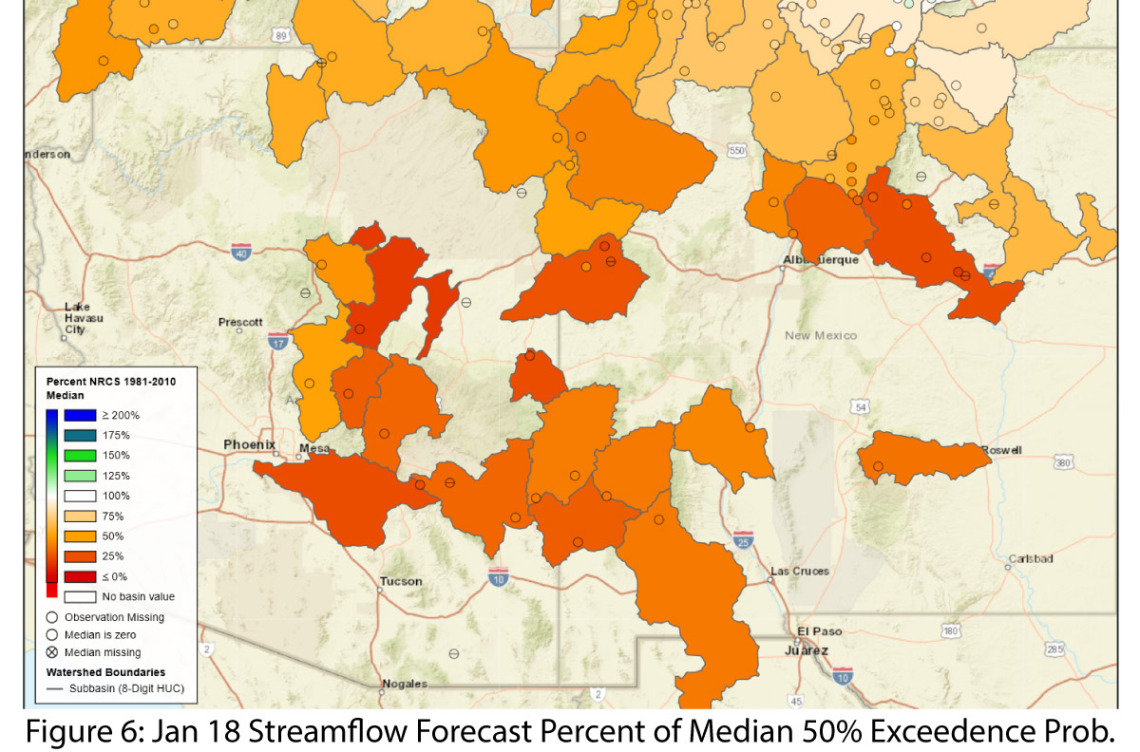
Snowpack and Water Supply: Snow water equivalent (SWE) data from the NRCS highlights how snow conditions deviate from the 1981-2010 median (Fig. 5). Many of the region’s reservoirs are at or below the values recorded at this time last year, and most are also below their long-term average (see Arizona and New Mexico reservoir storage). The implications for the current conditions and the La Niña forecast are also reflected in streamflow forecasts (Fig. 6).
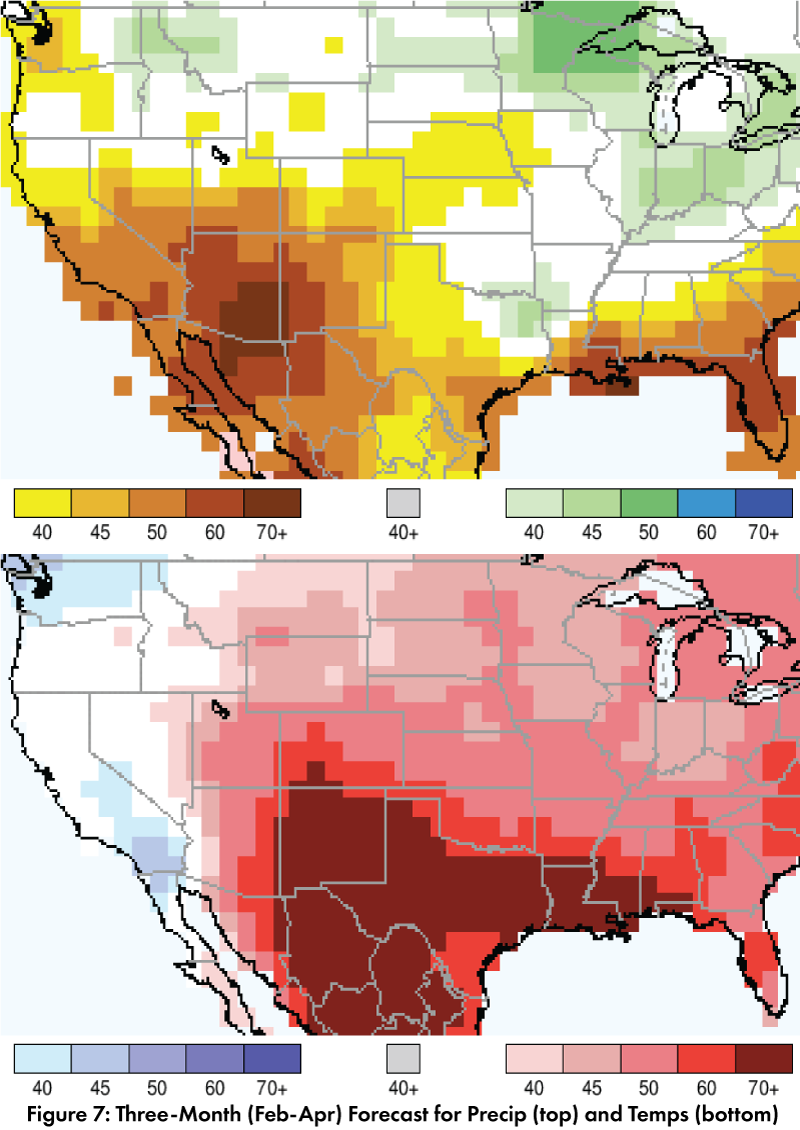
ENSO Tracker: Moderate La Niña conditions are present and are expected to continue through winter (see ENSO-tracker for details). If the region records below-average precipitation, as is forecast in most monthly and seasonal outlooks (see below, Fig. 7), this does not bode well for drought conditions in the Southwest.
Precipitation and Temperature Forecast: The three-month outlook for Feb through Apr calls for increased chances for below-normal precipitation across the southwestern U.S. and northern Mexico (Fig. 7, top). The three-month temperature outlook calls for increased chances of above normal temperatures across much of the southwestern U.S. and northern Mexico (Fig. 7, bottom).
Online Resources
- Figures 1, 2 - West Wide Drought Tracker - wrcc.dri.edu/wwdt
- Figure 3 - National Centers for Environmental Information - ncdc.noaa.gov/sotc
- Figure 4 - U.S. Drought Monitor - droughtmonitor.unl.edu
- Figure 5, 6 - National Resource Conservation Service - nrcs.usda.gov
- Figure 7 - International Research Institute for Climate and Society - iri.columbia.edu