Southwest Climate Outlook February 2021 - Climate Summary
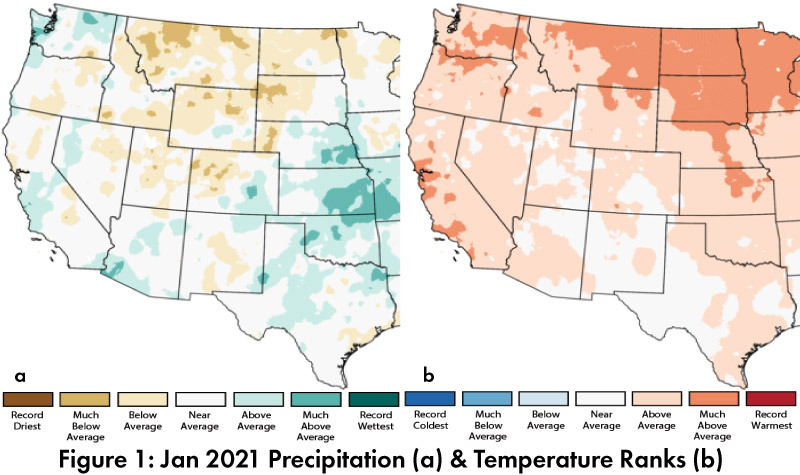
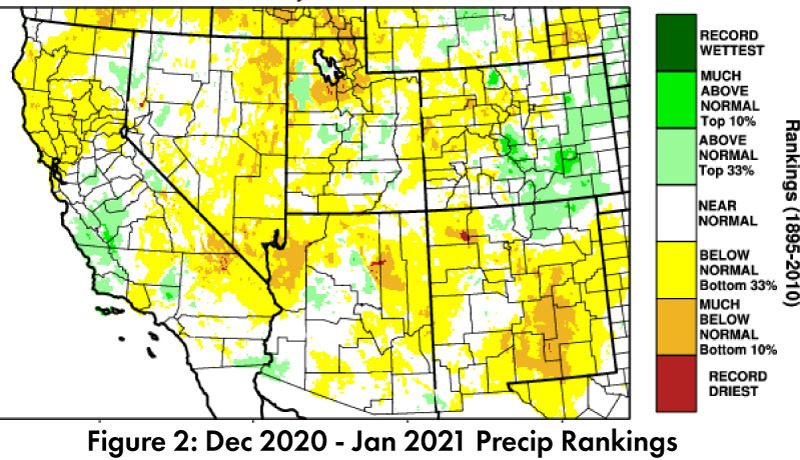
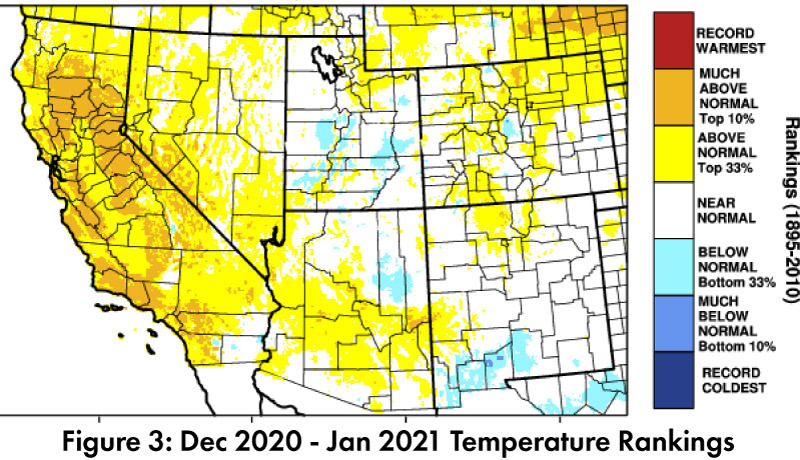
Monthly Precipitation and Temperature: January precipitation was average to above average across most of Arizona and below average to above average in most of New Mexico (Fig. 1). January temperatures ranged between average and above average in most of Arizona and New Mexico (Fig. 2). Precipitation ranks for the last two months show most of the Southwest at or below normal (Fig. 2), while temperatures for the same period were mostly at or above normal (Fig. 3).
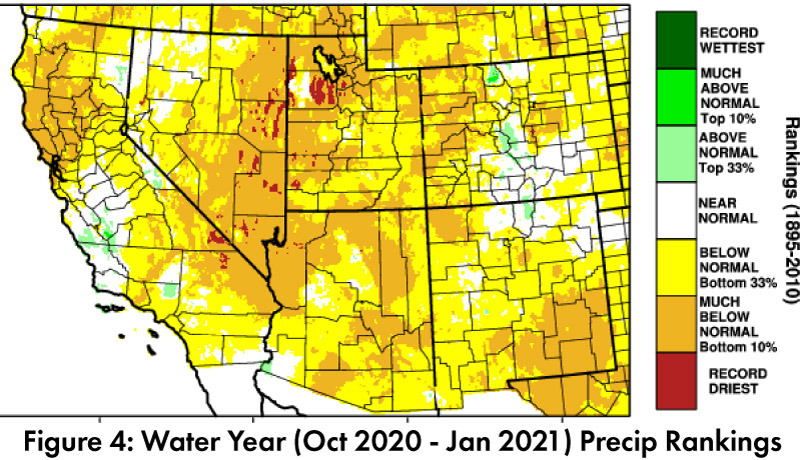
Drought: Water year precipitation reveals a widespread pattern of below normal and much below normal conditions across the Southwest (Fig. 4). The Feb 9 U.S. Drought Monitor (USDM) for the U.S. Southwest showed some improvement in parts of Arizona after the precipitation activity in January (Fig. 5), but still has a majority of the region classified as experiencing extreme drought (D3) or exceptional drought (D4).
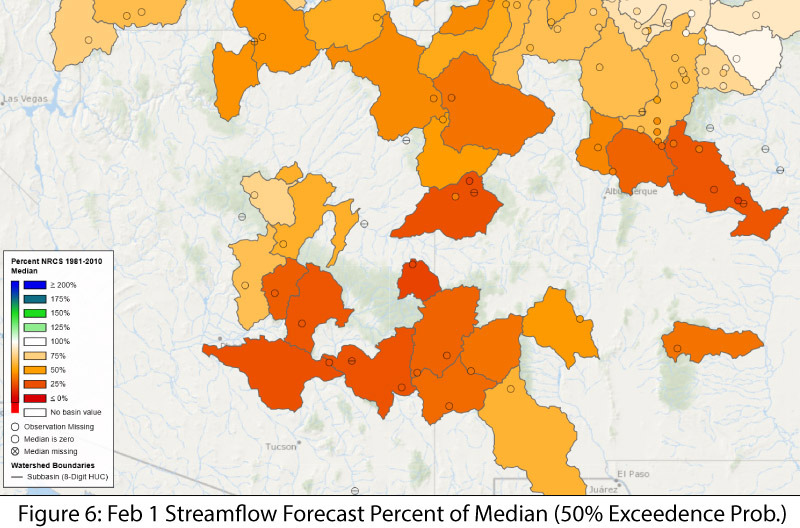
Snowpack and Water Supply: Snow water equivalent (SWE) is well below the 1981-2010 median for much of the region (see the NRCS website for details), and streamflow forecasts are similarly lagging behind (Fig. 6). Many of the reservoirs in the region are at or below the values recorded at this time last year. Most are below their long-term average (see Arizona and New Mexico reservoir storage).
ENSO Tracker: La Niña conditions are present and are expected to continue through winter (see ENSO-tracker). Despite a run of storms in January, the expectation is for cumulative cool-season totals to be below average for much of the Southwest. This will almost certainly intensify the current drought conditions.
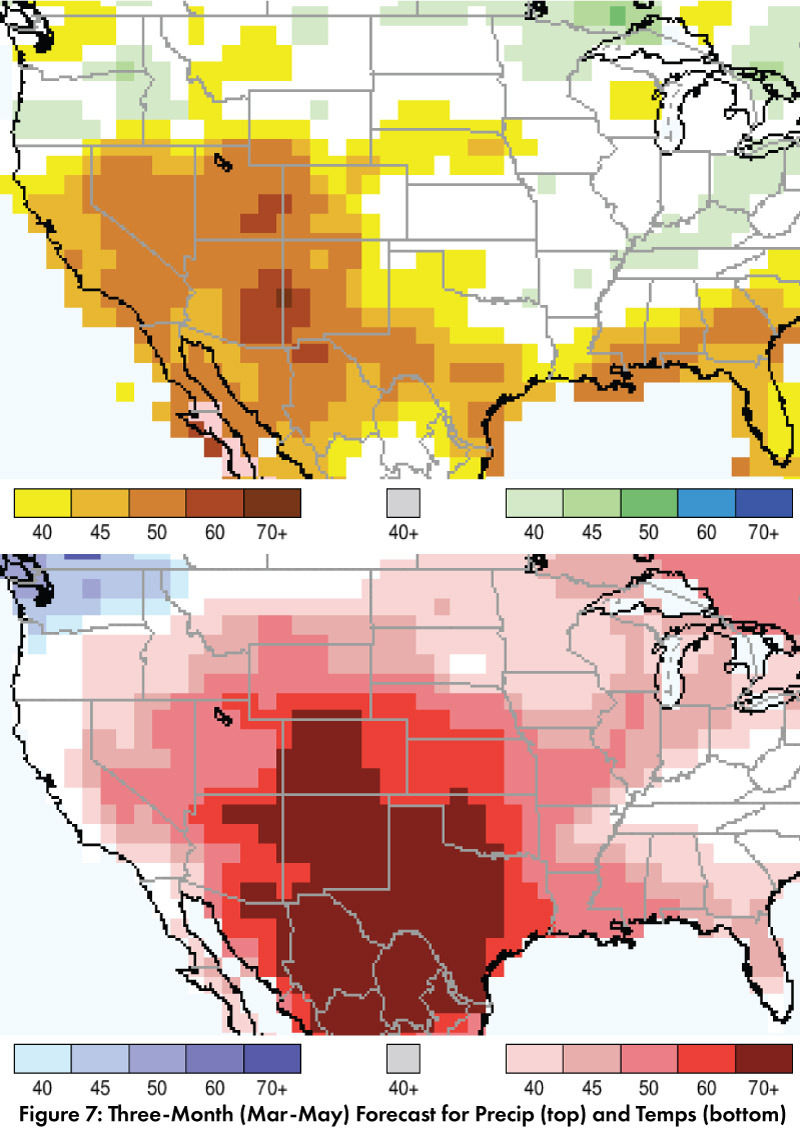
Precipitation and Temperature Forecast: The three-month outlook for Mar through May calls for increased chances for below-normal precipitation across the southwestern U.S. and northern Mexico (Fig. 7, top). The three-month temperature outlook calls for increased chances of abovenormal temperatures across much of the southwestern U.S. and northern Mexico (Fig. 7, bottom).
Online Resources
- Figures 1, 2 - West Wide Drought Tracker - wrcc.dri.edu/wwdt
- Figure 3 - National Centers for Environmental Information - ncdc.noaa.gov/sotc
- Figure 4 - U.S. Drought Monitor - droughtmonitor.unl.edu
- Figure 5, 6 - National Resource Conservation Service - nrcs.usda.gov
- Figure 7 - International Research Institute for Climate and Society - iri.columbia.edu