Southwest Climate Outlook - El Niño Tracker - September 2020
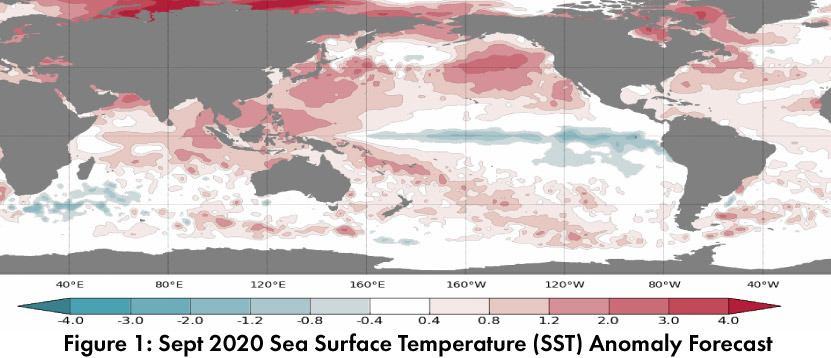
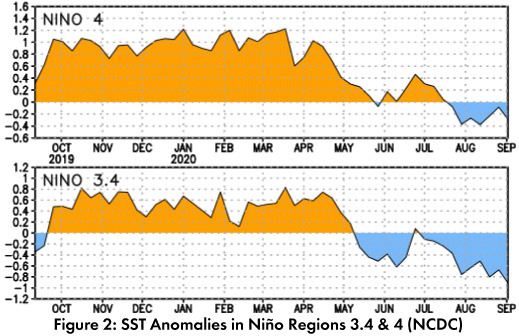
Sea surface temperature (SST) forecasts show cooling across the equatorial Pacific (Fig. 1), extending the pattern of the last few months (Fig. 2). La Niña conditions are now considered to be present by most major outlooks. These conditions are forecast to remain a La Niña event through winter 2020.
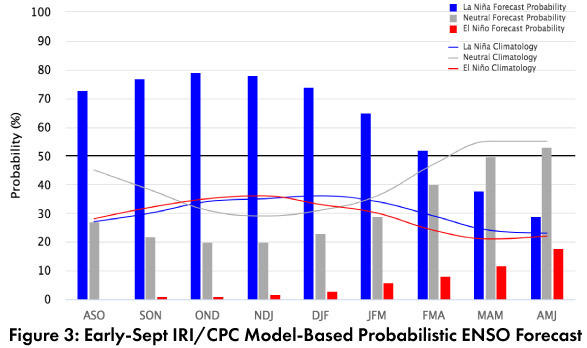
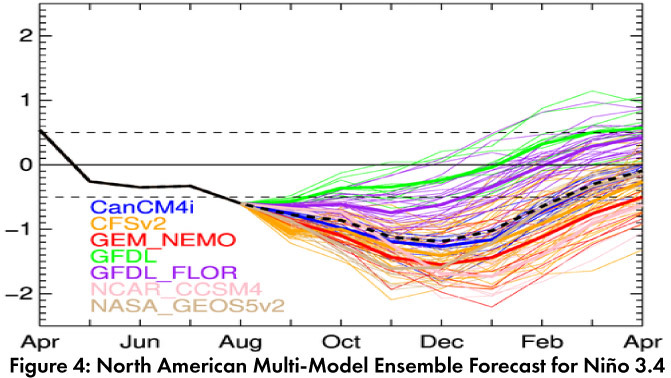
Forecast Roundup: On Sept 10, the NOAA Climate Prediction Center (CPC) ENSO status was at La Niña Advisory. The CPC called for a 75-percent chance of La Niña continuing through winter 2020-2021. On Sept 10, the International Research Institute (IRI) issued an ENSO Quick Look (Fig. 3), noting “SSTs in the east-central Pacific are below average, and most of the atmospheric variables are consistent with La Niña conditions”. On Sept 10, the Japanese Meteorological Agency (JMA) maintained its call for a 70-percent chance of La Niña conditions to last through winter 2020-2021. On Sept 15, the Australian Bureau of Meteorology extended a La Niña alert, noting further cooling in both the observed SSTs and the models and outlooks for the rest of 2020 and into 2021. The North American Multi-Model Ensemble (dashed black line, Fig. 4) has moved into La Niña territory, and is projected to remain there until early 2021.
Summary: La Niña conditions are observed to be present, and most forecasts and outlooks call for these conditions to last through winter 2020-2021. La Niña tends to suppress tropical storm activity in the eastern pacific (and enhance that activity in the Atlantic), and so far 2020 has generally followed that pattern. La Niña events also tend to result in drier than normal conditions over winter in the Southwest, a pattern that is represented in the monthly and seasonal outlooks. This will exacerbate accumulated precipitation deficits from the below average monsoon of 2020. It should be noted that La Niña conditions do not guarantee a drier than normal winter, but that this is the expected pattern, particularly when the strength of the event is either moderate or strong.
Online Resources
- Figures 1 - Australian Bureau of Meteorology - bom.gov.au/climate/enso
- Figure 2 - NOAA - Climate Prediction Center - cpc.ncep.noaa.gov
- Figure 3 - International Research Institute for Climate and Society - iri.columbia.edu
- Figure 4 - NOAA - Climate Prediction Center - cpc.ncep.noaa.gov