Southwest Climate Outlook - El Niño Tracker - February 2021
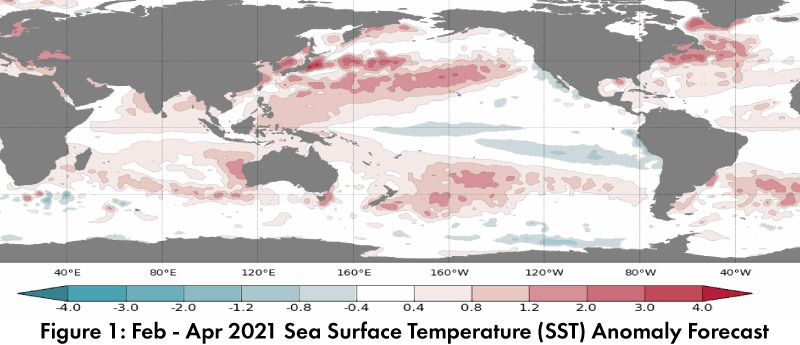
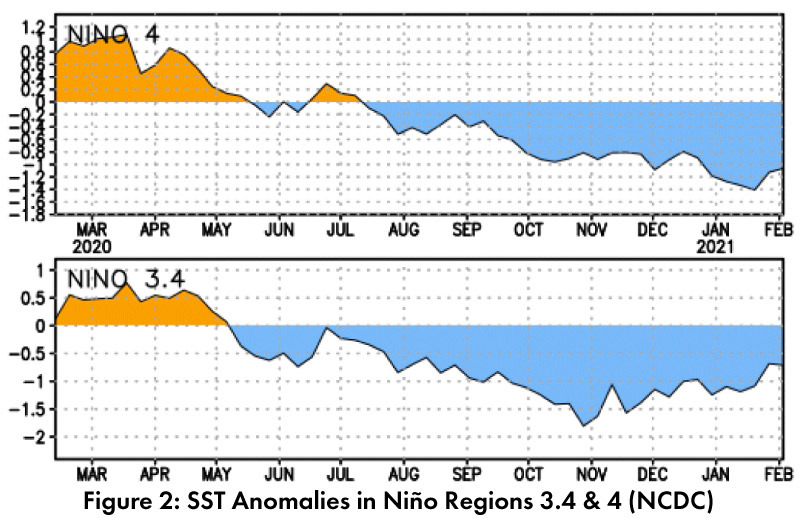
Sea surface temperature (SST) forecasts for February – April 2021 call for below normal conditions across much of the equatorial Pacific (Fig. 1). These forecasts and the current anomalies (Fig. 2) are pointing towards a gradual return to neutral conditions. International climate outlooks generally reflect this trend, and see La Niña conditions persisting through winter 2020-2021 before returning to normal conditions over spring 2021.
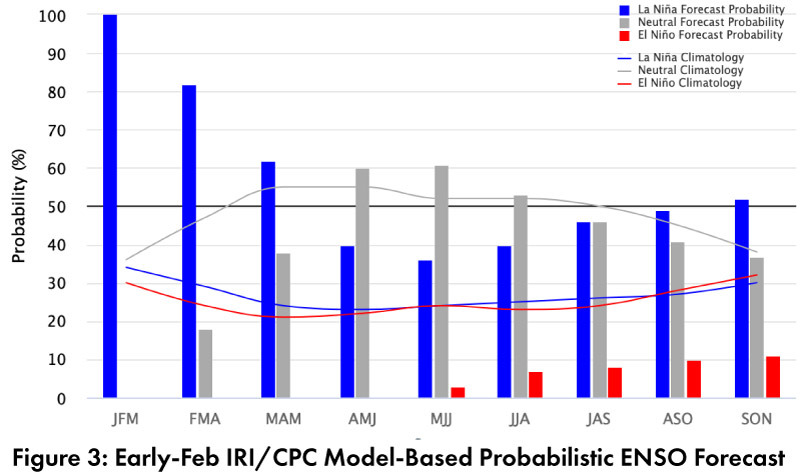
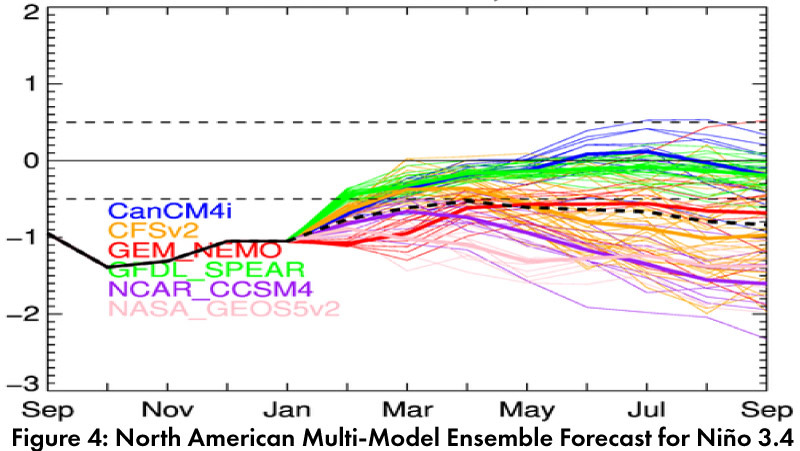
Forecast Roundup: On Feb 10, the Japanese Meteorological Agency (JMA) maintained its observation of an ongoing La Niña event, and with an 80-percent chance that these conditions “will fade into ENSO-neutral” by spring. On Feb 11, the NOAA Climate Prediction Center (CPC) ENSO status was at La Niña Advisory. The CPC called for a 60-percent chance of transition to ENSO-neutral during late spring or early summer. On Feb 11, the International Research Institute (IRI) issued an ENSO Quick Look (Fig. 3), noting a “majority of the model forecasts predict SSTs to be cooler than the threshold of La Niña SST conditions through the winter, dissipating during spring”. On Feb 16, the Australian Bureau of Meteorology was at official La Niña status and highlighted persistent La Niña conditions that were likely to return to neutral over the spring. The North American Multi-Model Ensemble (solid and dashed black line, Fig. 4) indicates La Niña conditions are expected to return towards ENSO-neutral conditions over the next few months.
Summary: La Niña conditions are present and should remain in place through winter and into early spring. Not unexpectedly given the La Niña status, the monthly and seasonal climate outlooks continue to forecast drier than normal conditions in the Southwest over the same period. La Niña does not mean zero precipitation, but does typically mean less frequent precipitation events and lower seasonal totals. There are exceptions to this pattern, but it is one of the more robust and predictable outcomes in the U.S. Southwest.
Online Resources
- Figures 1 - Australian Bureau of Meteorology - bom.gov.au/climate/enso
- Figure 2 - NOAA - Climate Prediction Center - cpc.ncep.noaa.gov
- Figure 3 - International Research Institute for Climate and Society - iri.columbia.edu
- Figure 4 - NOAA - Climate Prediction Center - cpc.ncep.noaa.gov